Neo4j, the global leader in graph database technology, has announced a significant expansion of the analytical capabilities within Bloom, its flagship graph exploration and visualization tool. This update addresses a long-standing limitation for data analysts by introducing the ability to run Graph Data Science (GDS) algorithms across an entire database directly from the Bloom interface. Previously, Bloom’s analytical reach was confined to the "Scene"—the specific subset of data currently visible on the user’s screen. This transition from local-only analysis to whole-graph projections represents a major shift in how organizations can derive global insights from complex, interconnected datasets without requiring extensive coding expertise.
The Evolution of Graph Exploration and Analytics
Graph databases have become an essential component of the modern data stack, particularly for use cases involving fraud detection, supply chain optimization, and recommendation engines. While traditional relational databases excel at structured, tabular data, graph databases like Neo4j are designed to prioritize the relationships between data points. Neo4j Bloom was introduced to provide a visual gateway into these complex structures, allowing non-technical users and seasoned analysts alike to explore data through an intuitive, searchable interface.
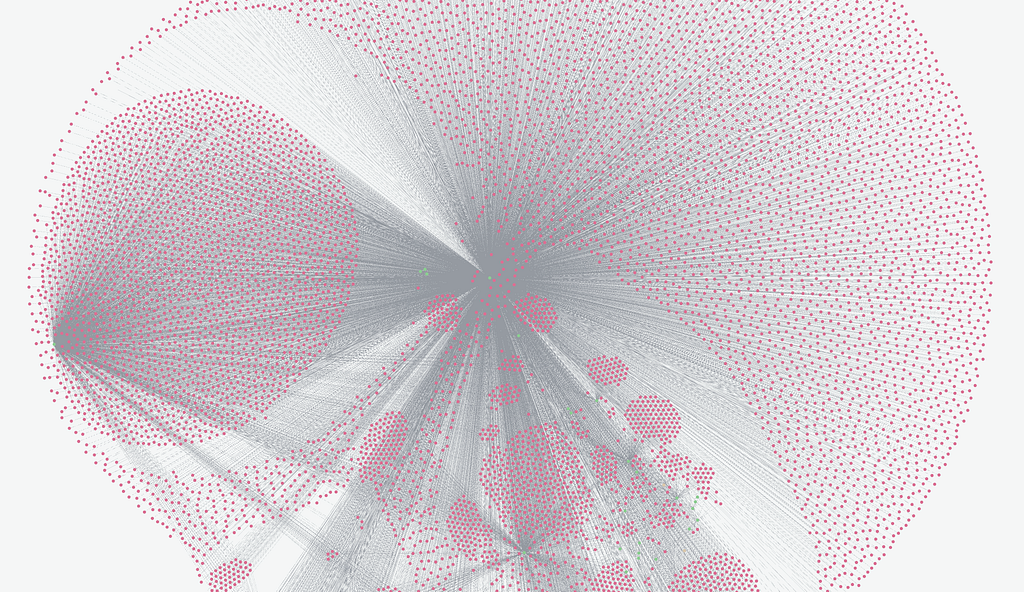
For several years, Bloom has allowed users to apply data science algorithms to their current visual "Scene." This was highly effective for micro-level analysis—such as identifying the most influential person in a small social circle or finding a specific bottleneck in a local supply route. However, as datasets have grown in both scale and complexity, the need for a macro-level perspective became undeniable. The latest update bridges this gap, allowing the underlying power of Neo4j’s Graph Data Science library to be harnessed at scale, providing a "bird’s-eye view" of the entire network while maintaining the tool’s signature ease of use.
Understanding the Shift: Local vs. Global Projections
The core of this update lies in how graph algorithms utilize "projections." In graph theory, a projection is a temporary, in-memory representation of a specific subset of the graph’s structure. It isolates relevant nodes and relationships to optimize the performance of mathematical computations.
In the previous iteration of Bloom, projections were limited to the data already loaded into the user’s active workspace. While this offered a fast and low-impact way to test hypotheses, it suffered from "sampling bias." If an analyst was looking at a small group of ingredients in a recipe database, a centrality algorithm might identify "butter" as a key node within that specific soup-focused subset. However, that result might not hold true when considering the millions of other recipes in the full database.
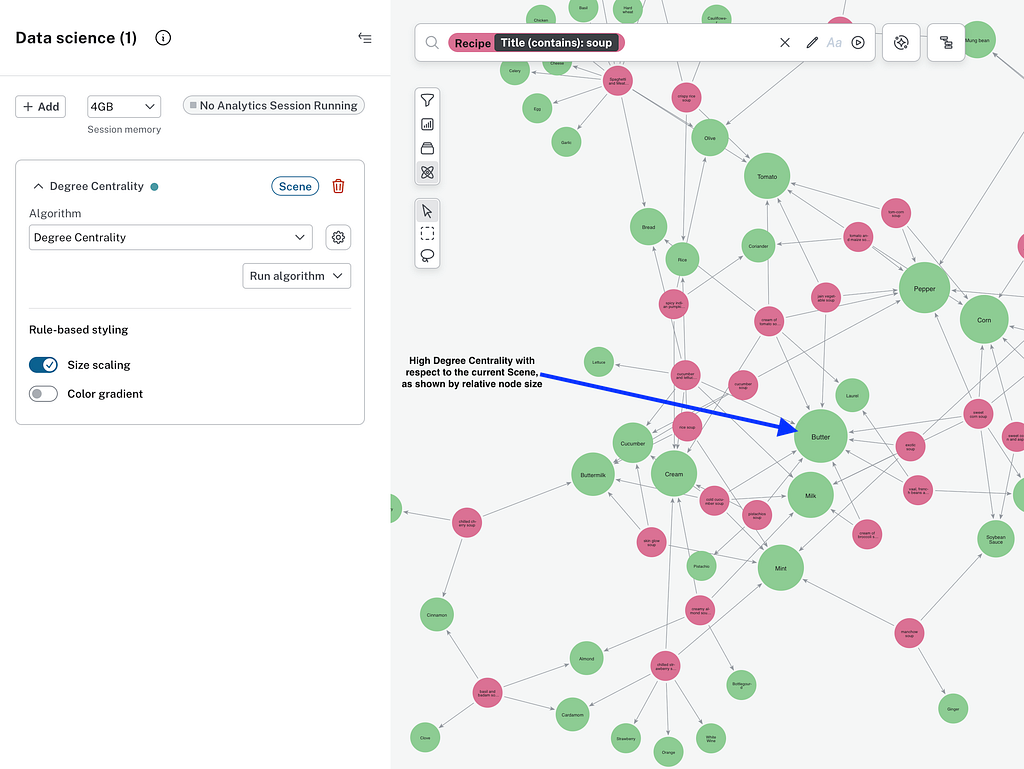
The new "whole-graph projection" capability allows Bloom to create these projections from the entire underlying database. This ensures that the results—whether they are centrality scores, community assignments, or importance rankings—are mathematically accurate across the organization’s entire data ecosystem. Furthermore, while local scene results were temporary and stored only within the visualization, the results from whole-graph projections are written back to the database as properties. This enables the insights to be used by other applications, scheduled tasks, or different team members, creating a "single source of truth" for graph-derived metrics.
Technical Mechanisms and Algorithm Applications
The integration utilizes either the Neo4j Graph Data Science (GDS) plugin or the Aura Graph Analytics (AGA) service. By removing the requirement to write Cypher queries or Python code to trigger these enterprise-grade algorithms, Neo4j is effectively democratizing high-level data science.
The algorithms now accessible via this whole-graph approach generally fall into two categories:
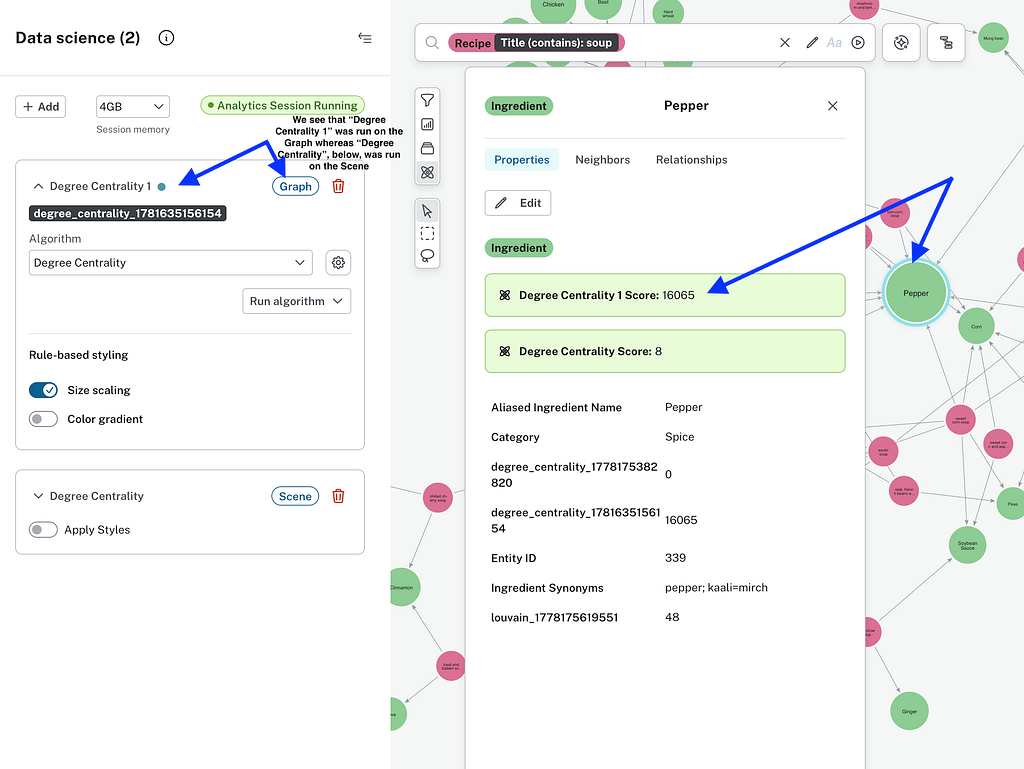
- Centrality Algorithms: These identify the "movers and shakers" within a network. Degree Centrality, for instance, counts the number of direct connections a node has. In a corporate network, this might identify a highly connected employee; in a logistics network, it identifies a hub through which most goods pass. By running this on the whole graph, an analyst can see that while a node looks important in a small scene, it may be insignificant compared to the global network, or vice versa.
- Community Detection: These algorithms, such as Louvain or Label Propagation, identify clusters of nodes that are more densely connected to each other than to the rest of the network. This is vital for segmenting customers, detecting "fraud rings" in insurance data, or understanding functional modules in biological protein-interaction networks.
Chronology of Development and Integration
The path to this update reflects Neo4j’s broader strategy of integrating visualization with deep analytics.
- 2018–2019: Bloom was launched as a standalone exploration tool, focusing on search-based navigation and visual styling.
- 2020: Neo4j launched the Graph Data Science library, providing a unified framework for executing complex algorithms on graph data.
- 2021–2022: Initial integration allowed Bloom users to run algorithms on "Scenes," providing the first taste of "no-code" graph science.
- 2023–2024: The introduction of Aura Graph Analytics and the subsequent update to Bloom enabled the "whole-graph" capability, responding to enterprise demands for scalable, persistent analytical results.
This timeline suggests a move away from visualization as a mere "viewing" tool toward visualization as a "command center" for data science operations.
Industry Implications and Strategic Value
The move to allow whole-graph projections within a no-code environment has significant implications for the broader data analytics industry. Market research indicates that the graph database market is expected to grow at a Compound Annual Growth Rate (CAGR) of over 20% through 2030. As adoption increases, the "talent gap" becomes a primary hurdle; there are simply not enough graph-specialized data scientists to meet demand.
By empowering business analysts—who understand the domain but may not be proficient in Cypher—to run global algorithms, Neo4j is reducing the operational friction associated with graph projects. This "democratization" allows for faster prototyping. An analyst can use Bloom to fine-tune an algorithm’s parameters visually, observe the results, and once satisfied, hand off the configuration to a data engineer to be scheduled for production using the GDS Python client or Cypher API.
Furthermore, the ability to "write back" results to the database is a critical feature for enterprise workflows. It transforms the visualization tool from a passive observer into a data generator. When a community detection algorithm identifies a new fraud pattern and writes that "Community ID" back to the node, that information becomes immediately available to real-time flagging systems and reporting dashboards across the company.
User Workflow and Best Practices
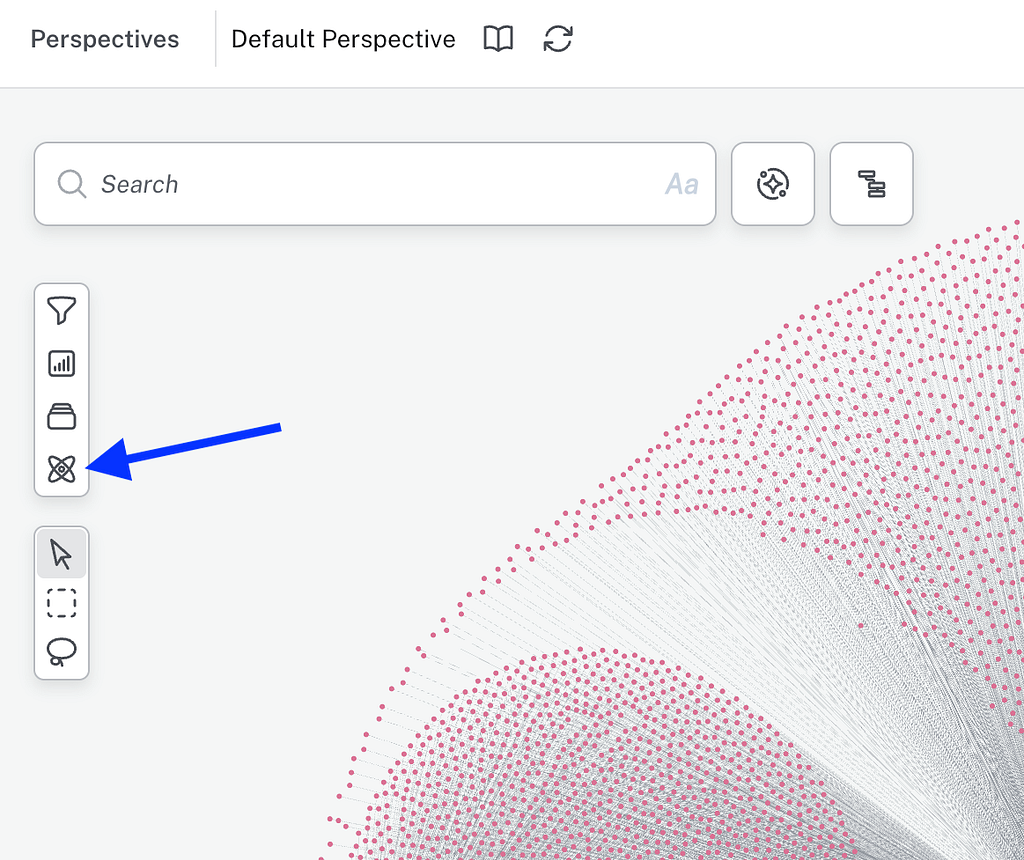
To leverage these new features, users must follow a structured workflow within the Bloom interface. Upon connecting to an instance equipped with GDS or Aura Graph Analytics, a new "Data Science" icon appears. The process involves:
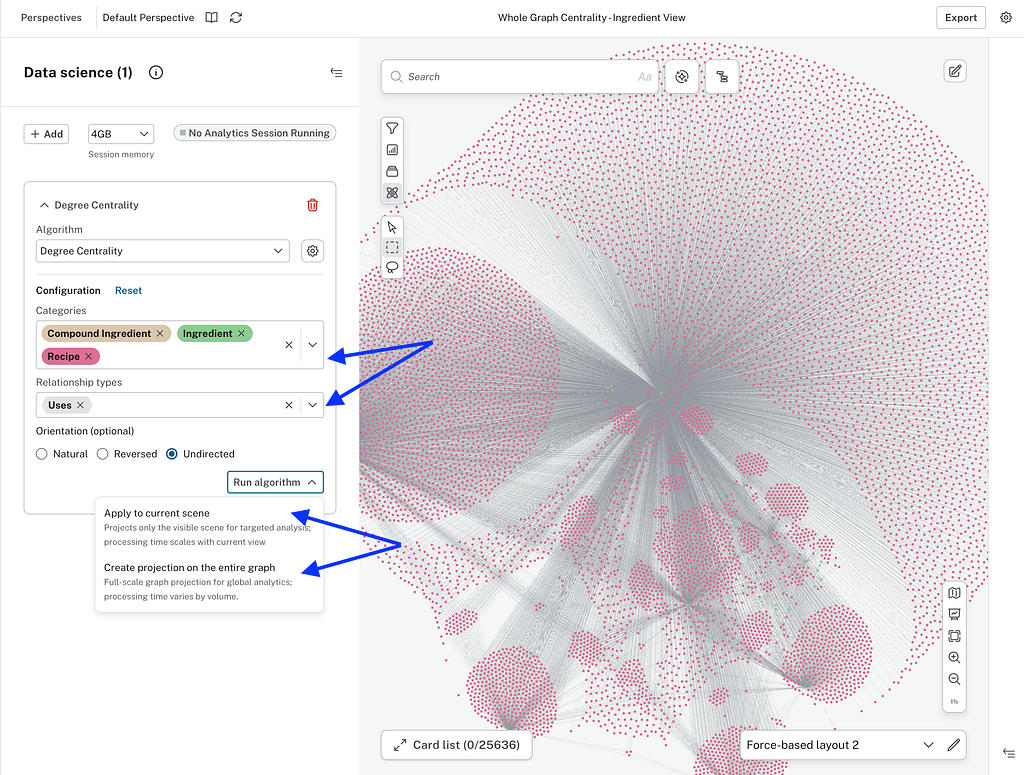
- Algorithm Selection: Choosing the right tool for the question (e.g., PageRank for influence, Louvain for clustering).
- Configuration: Defining the scope by selecting specific node labels and relationship types. This ensures the algorithm isn’t processing "noise" data.
- Weighting and Directionality: Assigning importance to relationships based on properties (like transaction value) and determining if the relationship should be treated as one-way or bi-directional.
- Execution Choice: Deciding between "Apply to current scene" (for quick, local experimentation) or "Create projection on the entire graph" (for definitive, database-wide results).
Experts suggest that the local scene should be used as a "proving ground." Because whole-graph projections can be computationally expensive on massive datasets, testing the logic on a smaller subset ensures the parameters are correct before committing to a full-scale run.
Conclusion and Future Outlook
The introduction of whole-graph projections in Neo4j Bloom marks a pivotal moment in the maturity of graph tools. It acknowledges that visualization is most powerful when it is backed by the full weight of the underlying data, rather than just a visible fraction of it. By blending the intuitive nature of a visual explorer with the mathematical rigor of global graph algorithms, Neo4j is providing a pathway for organizations to move from simple data discovery to sophisticated predictive analytics.
As graph technology continues to integrate with artificial intelligence and machine learning—specifically through Graph Neural Networks (GNNs) and Knowledge Graphs for Large Language Models (LLMs)—the ability to easily project and analyze entire databases will likely become the standard requirement for any enterprise-grade data platform. For now, Bloom’s update offers a compelling glimpse into a future where the complexities of data science are increasingly hidden behind elegant, accessible interfaces, allowing the "seeds of science" to flourish into actionable business intelligence.
Related posts: