For more than a decade, DavidWalshBlog has served as a foundational pillar for the global JavaScript development community, drawing upwards of 50,000 unique visitors every month. Developers ranging from novices to enterprise architects rely on the platform to master code snippets, troubleshoot complex bugs, and refine their software engineering workflows. However, rapid growth and an extensive archive of legacy content eventually collided with modern browser rendering standards. A significant portion of the site’s readership was experiencing sluggish performance, prompting a deep dive into technical optimization using real-user monitoring tools.
The investigation, spearheaded by performance tracking platforms, revealed that the underlying issue was not related to server response times or heavy JavaScript bundles, but rather to Cumulative Layout Shift (CLS). For a site heavily dependent on search engine optimization (SEO) and organic discovery, addressing this metric became a critical operational priority to maintain both user engagement and search visibility.
Understanding Core Web Vitals and the Threat of Layout Instability
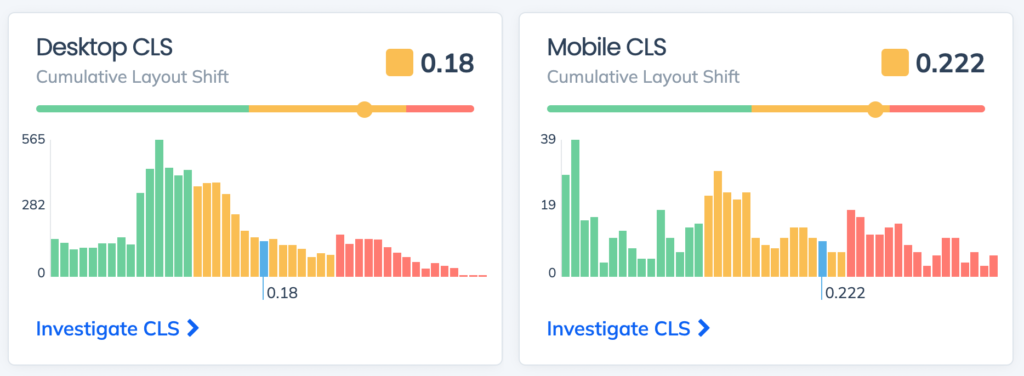
Core Web Vitals represent Google’s standardized set of metrics designed to quantify the real-world user experience of web pages. While metrics such as Largest Contentful Paint (LCP) evaluate loading performance and Interaction to Next Paint (INP) measure responsiveness, Cumulative Layout Shift focuses entirely on visual stability. CLS tracks the total sum of all unexpected layout shifts that occur during the entire lifespan of a page.
Every web user has encountered this frustration: attempting to click a link or read a paragraph, only for an advertisement, font swap, or late-loading image to render, violently pushing the content down the screen and causing the user to click the wrong element. These unpredictable movements make a web application or content portal feel sluggish, broken, and frustrating to navigate.
Beyond immediate user dissatisfaction, search engines have heavily integrated Core Web Vitals into their ranking algorithms. For independent bloggers, digital media outlets, and e-commerce platforms alike, search traffic serves as the primary driver of audience acquisition and revenue. A degraded CLS score directly translates to suppressed page rankings, lower visibility, and a diminished capacity to reach audiences. Consequently, rectifying the CLS inefficiencies on DavidWalshBlog was not merely an aesthetic enhancement, but a vital business and editorial necessity.
The Illusion of Synthetic Testing: Why Google Lighthouse Falls Short
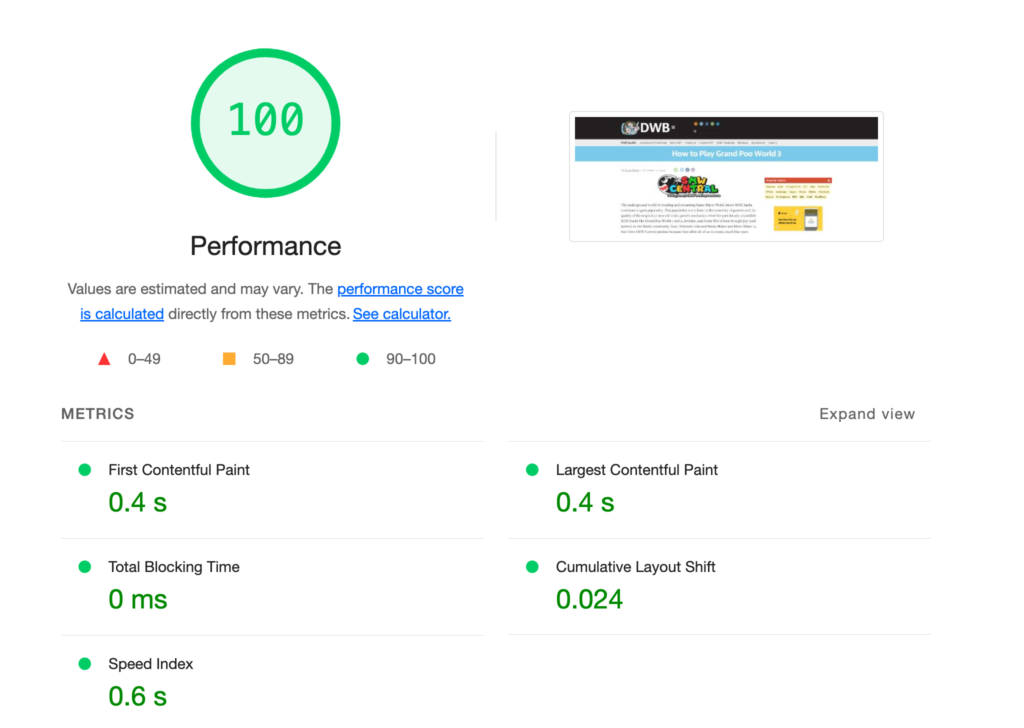
When technical debt or performance degradation appears on a website, the standard industry reflex for developers is to execute a Google Lighthouse audit. When this diagnostic test was initially run on DavidWalshBlog, the resulting score displayed a pristine, near-perfect performance evaluation. In theory, the audit suggested that the site required no immediate remediation.
However, experienced web reliability engineers emphasize that synthetic testing environments can frequently present a false sense of security. Google Lighthouse evaluates a web page under controlled, laboratory conditions—typically utilizing a high-end desktop workstation connected to a high-speed broadband network located within a specific geographic region. It fails to account for the fragmented reality of global web traffic.
Real users navigating DavidWalshBlog access the platform from mobile devices on throttled cellular networks, older hardware configurations, and varied geographical locations with fluctuating latencies. Synthetic audits cannot replicate the asynchronous loading of third-party scripts, advertisements, and media assets under unpredictable network strain. Recognizing this discrepancy, the site utilized Real User Monitoring (RUM) via Request Metrics to capture actual performance data gathered from live visitors across the globe. The RUM analytics immediately exposed a stark divergence from the laboratory tests, highlighting persistent CLS degradation across both desktop and mobile user segments.
Isolating the Root Cause: The Anatomy of Content Shifting
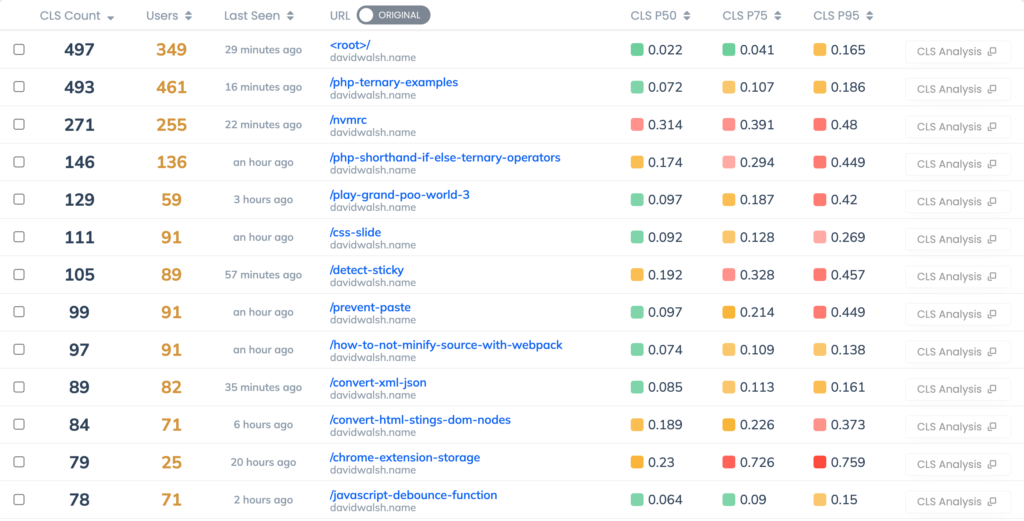
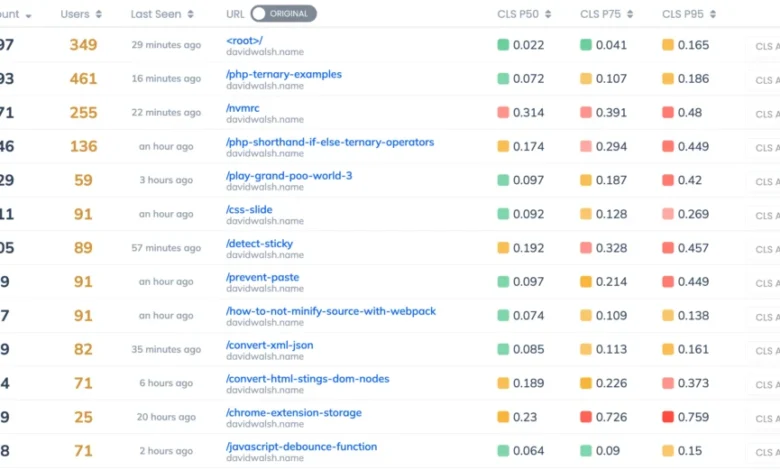
With reliable real-world data confirming the existence of layout instability, the next phase of the investigation required granular page-level analysis. DavidWalshBlog features a vast, multi-year archive comprising hundreds of distinct technical tutorials and developer interviews. Rather than treating the entire domain as a monolithic entity, telemetry tools allowed administrators to isolate specific URLs exhibiting the most severe performance penalties.
While high-traffic entry points like the site’s root index maintained acceptable stability metrics, individual archived posts—such as deep-dive tutorials on specialized gaming projects and industry interviews—demonstrated alarming CLS scores. Deeper telemetry tracing identified that the primary DOM element responsible for the layout shifts was consistently nested within the article body, specifically targeting initial paragraph elements (main > article > p).
The diagnostic consensus pointed toward a ubiquitous web development oversight: unconstrained media assets. Images represent the single most common catalyst for cumulative layout shifts across the modern web. When a browser parses an HTML document, it constructs the Document Object Model (DOM) and begins laying out elements before all network assets are fully retrieved. If an image tag lacks explicit dimension parameters, the browser allocates a default, nominal space—frequently defaulting to zero height and width—while parsing the surrounding text. Once the image binary finally downloads from the server, the browser recalculates the layout, abruptly forcing the surrounding paragraphs and headings to shift downward to accommodate the newly discovered graphical dimensions. On content-heavy pages laden with multiple visual aids, this cascading reflow occurs repeatedly, severely damaging the visual stability score.
Implementing Remedial Engineering Standards
Eliminating layout instability caused by images requires developers to provide explicit spatial hints to the user agent before the asset download initiates. By defining explicit width and height attributes directly within the HTML markup, the browser reserves the exact geometric aspect ratio required by the asset within the render tree. When the image file subsequently completes its download, it simply fills the pre-allocated canvas without disrupting adjacent text blocks or navigational elements.
Industry best practices mandate that these dimensions be declared as unitless integer attributes within the <img> tag, preserving flexibility for responsive CSS styling rules to scale the asset fluidly across varying viewports. Hardcoding these attributes ensures that the browser calculates the precise aspect ratio immediately during the initial parsing phase.
For platforms operating on enterprise content management systems like WordPress, addressing legacy content at scale presents a unique operational challenge. Manually editing hundreds of published historical articles to inject explicit height and width attributes into every image tag is economically unviable and prone to human error. Fortunately, modern content management architectures provide native programmatic hooks—such as WordPress’s internal dimension retrieval functions—which can dynamically parse media payloads, extract native asset dimensions, and inject the necessary markup attributes automatically during server-side rendering.
Measurable Outcomes and Ongoing Optimization

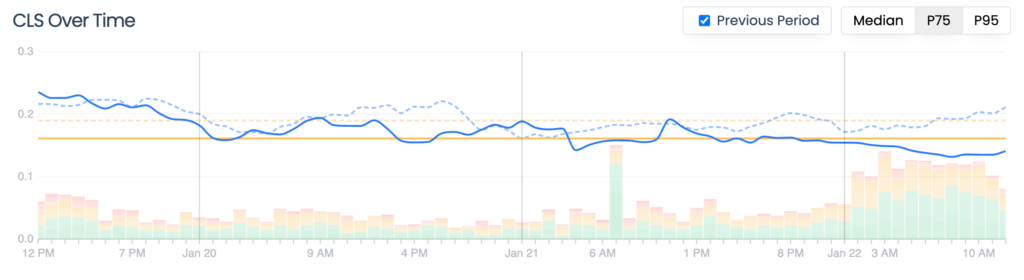
Following the deployment of these corrective measures across DavidWalshBlog, telemetry platforms recorded an immediate, quantifiable positive trend in user experience metrics. Within days of updating the asset rendering logic, the site’s aggregate Cumulative Layout Shift score dropped by 20 percent, settling near the 0.123 threshold and bringing the platform to the cusp of Google’s officially designated "Good" user experience bracket.
Despite this substantial progress, web performance engineering is an iterative, continuous discipline rather than a one-time deployment. Subsequent performance audits have indicated secondary optimization opportunities, particularly concerning typography loading behaviors and font-face rendering strategies, which will form the focus of subsequent engineering sprints.
Broader Implications for the Digital Publishing Ecosystem
The optimization journey of DavidWalshBlog serves as a case study for independent publishers, developers, and digital enterprises navigating the intersection of web standards, user experience, and search engine optimization. As core web metrics continue to influence search algorithmic weighting, failing to monitor and remediate real-world performance bottlenecks can result in quiet, compounding losses in organic traffic and audience reach.

The lessons derived from this technical intervention emphasize two fundamental truths for modern web architecture: synthetic testing tools should never supersede real-world user monitoring, and foundational HTML hygiene—such as explicitly declaring image dimensions—remains vital to maintaining visual stability in an increasingly complex digital landscape. By bridging the gap between laboratory audits and actual user telemetry, digital platforms can safeguard their technical infrastructure, enhance reader satisfaction, and secure their long-term visibility in an competitive search environment.