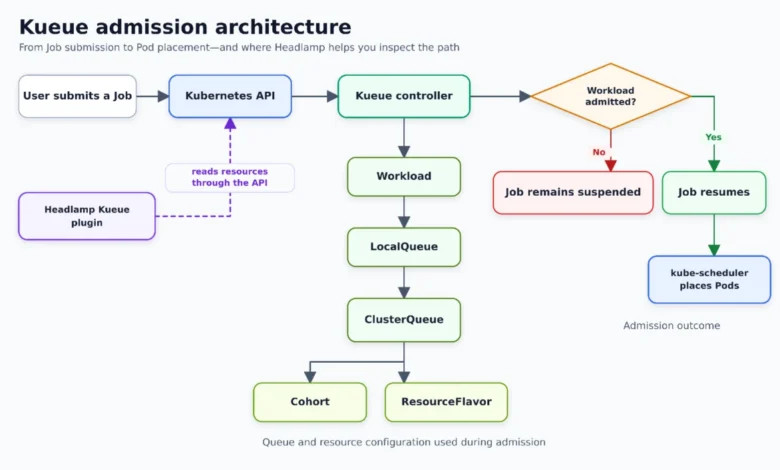
Kubernetes administrators and DevOps engineers frequently encounter a familiar operational hurdle: submitting a Kubernetes Job and watching as its associated Pods fail to materialize. Minutes tick by, yet the deployment remains suspended in a vacuum, completely devoid of application logs, and sometimes lacking even a basic Pod object to inspect. Within clusters governed by Kueue—the native Kubernetes job queue controller designed for batch and machine learning workloads—this behavior can be entirely standard operating procedure. Kueue may still be meticulously evaluating cluster resource availability to determine if the incoming Job has authorization to consume precious compute assets. Consequently, the initial diagnostic inquiry must shift from the traditional "Why is this Pod pending?" to a more foundational question: "Has Kueue admitted this workload?"
Addressing this operational visibility gap, the newly introduced Kueue plugin for Headlamp—developed as part of the CNCF LFX Mentorship program—brings comprehensive admission path investigation directly into the Headlamp graphical user interface. Instead of forcing platform engineers to manually reconstruct complex resource hierarchies across multiple command-line operations and unwieldy YAML manifests, this tooling allows operators to start directly at the Workload object. From there, users can parse condition messages and effortlessly traverse hyperlinks through LocalQueues, ClusterQueues, ResourceFlavors, and Cohorts.
Background Context and Architectural Foundations
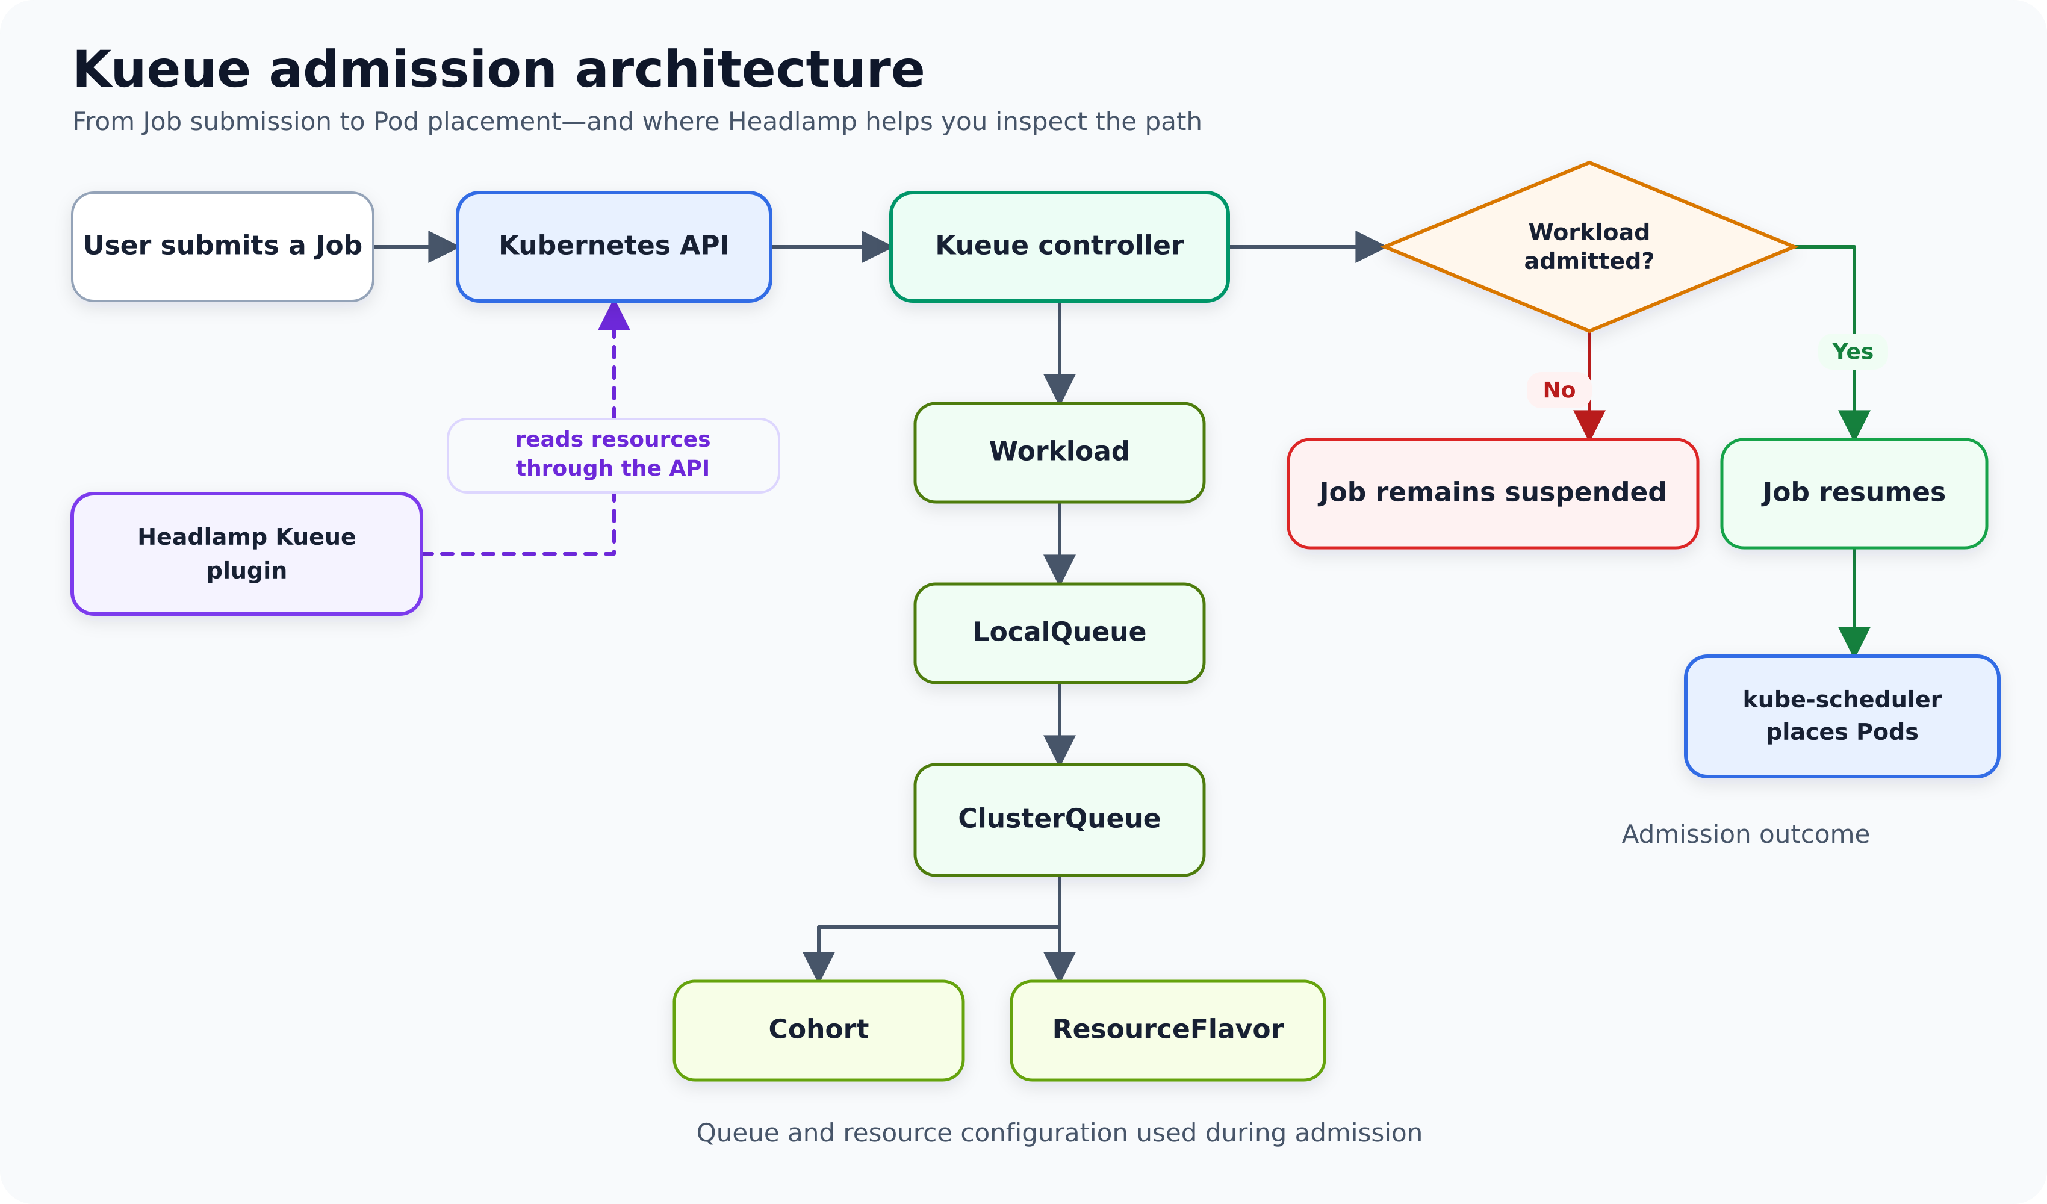
The complexity of modern cloud-native infrastructure has amplified the need for specialized batch scheduling and queue management. Traditional Kubernetes schedulers excel at placing individual pods onto nodes based on immediate constraints, but they historically lacked higher-level primitives for queueing, fair-sharing, and quota management across multi-tenant data science and batch processing pipelines. Kueue emerged to fill this critical vacuum, operating as a custom controller that manages job execution queues before handing admitted pods over to the default Kubernetes scheduler.
This division of labor establishes a two-phase lifecycle for workloads. Phase one belongs entirely to Kueue, which evaluates whether a requested job fits within configured quotas, borrowing limits, and priority classes. Phase two begins only after Kueue flips the admission switch, at which point the standard scheduler takes over node placement.
Prior to the integration of the Kueue plugin into Headlamp, diagnosing a blockage in the first phase required a tedious sequence of command-line gymnastics. Operators had to query workloads, describe individual resources, cross-reference local queues with cluster queues, and manually inspect resource flavors. The introduction of version 0.1.0-alpha of the Kueue plugin transforms this investigative workflow into a cohesive, graphical user experience.
Chronology of Development and Release
The path toward seamless graphical Kueue observability advanced significantly during the 2026 Term 2 cycle of the Cloud Native Computing Foundation (CNCF) LFX Mentorship program. Initiated to bridge the gap between complex batch controller telemetry and user-friendly cluster administration, the project was spearheaded by developer Utkarsh Raj.
Crucial architectural guidance and technical reviews were provided by prominent open-source maintainers René Dudfield and Kevin Hannon. Throughout the development lifecycle, community feedback from both the Headlamp and Kueue ecosystems heavily influenced the design of the resource views, status presentation paradigms, navigation paths, and initial documentation suites. The resulting 0.1.0-alpha release debuted in October 2026, establishing a foundational read-only interface capable of navigating complex resource topologies through standard Kubernetes APIs.
Step-by-Step Diagnostic Methodology within Headlamp
When troubleshooting a stalled deployment using the Headlamp-first methodology, engineers follow a structured navigational pathway designed to isolate bottlenecks rapidly.
Step 1: Navigating to the Workloads View
The investigation invariably begins by accessing the Workloads panel within the Kueue section of the Headlamp interface. By filtering for the specific namespace containing the stalled Job, administrators can locate the corresponding Workload object generated by Kueue. Even before opening detailed views, the primary resource table offers immediate diagnostic cues regarding admission status. If no matching Workload appears, engineers are prompted to verify namespace selection, confirm that the Job was successfully routed to a LocalQueue, and ensure their Kubernetes credentials possess adequate RBAC permissions to list Kueue workloads.
Step 2: Analyzing Status Conditions and System Events
Selecting a Workload opens a detailed status view prioritizing current conditions—specifically focusing on QuotaReserved and Admitted flags—over raw YAML introspection. Condition messages often provide immediate clarity, such as noting that a ClusterQueue lacks sufficient CPU quota to satisfy the request. Accompanying this, the Events section logs recent state transitions and attempted evaluations by the Kueue controller.
Step 3: Evaluating Resource Requests and Assignments
A critical pitfall in batch job troubleshooting is underestimating aggregate resource demands. A Job configured with a parallelism factor of three and a request of one CPU per Pod actually demands three CPUs simultaneously. The Headlamp plugin aggregates PodSets and resource requests, allowing engineers to verify whether the cumulative demand exceeds available allocation pools before quota reservation occurs.
Step 4: Tracing LocalQueues and ClusterQueues
By following embedded hyperlinks from the Workload detail page, administrators can inspect the associated LocalQueue—the namespaced entry point connecting workloads to cluster-scoped resources. This step clarifies whether the job entered the anticipated queue and reveals competing workloads sharing the same queue. From there, jumping to the ClusterQueue view exposes overarching capacity metrics, nominal quotas, and current consumption levels across the multi-tenant environment.
Step 5: Assessing ResourceFlavors and Cohorts
When standard quotas are exhausted or specialized hardware is required, administrators can drill deeper into ResourceFlavors—which map compute classes to node labels, taints, and tolerations—and Cohorts. Cohorts enable multiple ClusterQueues to dynamically share unused capacity through sophisticated borrowing and lending policies. The Headlamp interface visualizes these parent-child relationships, fair-sharing weights, and resource groups, illuminating subtle constraints that might be throttling workload execution.
Technical Scope and Current Alpha Limitations
While the 0.1.0-alpha release represents a major leap forward in cluster observability, developers and maintainers have outlined distinct boundaries regarding its current functional scope.
The plugin operates strictly as a read-only telemetry layer for Kueue v1beta2 primitives, encompassing Cohorts, ClusterQueues, LocalQueues, ResourceFlavors, and Workloads. It does not introduce bespoke create, edit, stop, resume, or delete workflows specifically for Kueue objects. Instead, Headlamp relies on its existing native YAML editors and standard resource management capabilities, provided the operator’s underlying Kubernetes permissions permit such actions.
Furthermore, command-line utilities such as kubectl and kueuectl retain their vital importance for automation pipelines, GitOps continuous delivery workflows, and scripted cluster administration. The Headlamp plugin is intentionally positioned not as a complete replacement for CLI tooling, but as an interactive diagnostic accelerator designed to minimize cognitive overhead during high-pressure troubleshooting scenarios.
Fact-Based Analysis of Implications for Platform Engineering
The integration of Kueue observability into Headlamp underscores a broader evolutionary trend within the cloud-native ecosystem: the transition from raw infrastructure telemetry to contextual, domain-specific management interfaces. As organizations increasingly run massive machine learning training runs, financial simulations, and high-performance computing (HPC) workloads on Kubernetes, the operational complexity of resource contention has scaled exponentially.
By decoupling admission queue inspection from traditional pod-level debugging, platform engineering teams can drastically reduce Mean Time to Resolution (MTTR) for stalled deployments. Rather than wasting valuable engineering cycles investigating non-existent node capacity issues when a job is merely blocked by a cluster queue quota, operators can pinpoint policy bottlenecks in seconds.
As the Kueue plugin matures beyond its initial alpha phase, community contributors plan to refine object interaction models and expand UI-driven management capabilities based on ongoing user telemetry and GitHub issue discussions. For organizations seeking to tame the operational friction of multi-tenant batch processing on Kubernetes, the combination of Kueue’s powerful queuing logic and Headlamp’s intuitive graphical interface offers a compelling, standardized pathway toward robust cluster observability.