AWS DevOps Agent Unveils Private Connections for Enhanced Security and Operational Agility Across Hybrid and Multi-Cloud Environments

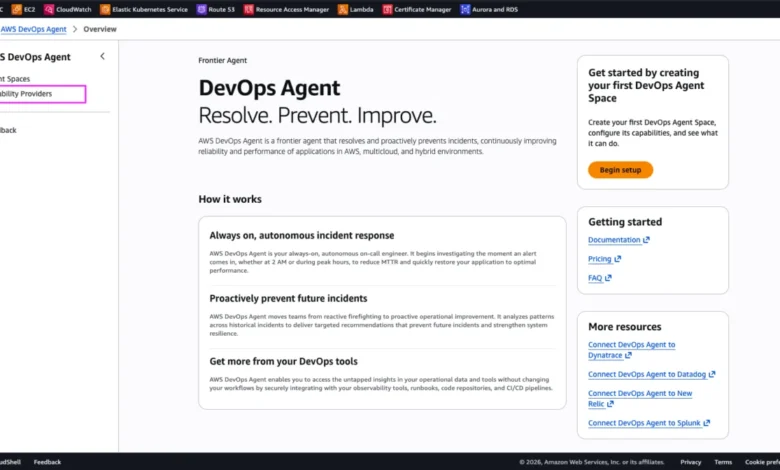
Amazon Web Services (AWS) has announced the launch of Private Connections for AWS DevOps Agent, a significant advancement designed to bolster security and streamline operations for organizations leveraging its AI-powered operational teammate. This new capability allows the AWS DevOps Agent to securely integrate with privately hosted tools and services across AWS Virtual Private Clouds (VPCs), multi-cloud environments, and on-premises data centers, eliminating the need for public internet exposure. The feature is critical for enterprises that rely on internal systems such as private package registries, self-hosted observability platforms like Grafana or Splunk, internal documentation APIs, and source control instances like GitHub Enterprise and GitLab, which are often isolated within private networks.
The AWS DevOps Agent serves as an always-available operations teammate, proactively preventing and resolving incidents, optimizing application reliability and performance, and managing on-demand Site Reliability Engineering (SRE) tasks. Its effectiveness is amplified through integration with existing observability tools, correlating telemetry, code, and deployment data to significantly reduce Mean Time To Repair (MTTR) and foster operational excellence. Many organizations extend the agent’s capabilities with custom tools built on the Model Context Protocol (MCP) and other proprietary integrations. However, the inherent security posture of these internal systems, typically residing within an Amazon VPC without public internet access, historically posed a connectivity challenge for the agent. Private Connections directly addresses this gap, creating a secure and seamless network path.
The Evolving Landscape of Enterprise Operations and the Need for Secure Connectivity
Modern enterprise IT environments are characterized by increasing complexity, spanning hybrid cloud architectures that combine public cloud services with on-premises infrastructure, and multi-cloud strategies that utilize services from various cloud providers. This distributed nature, while offering flexibility and resilience, also introduces significant challenges, particularly concerning security and compliance. Organizations are under constant pressure to protect sensitive data, maintain strict regulatory compliance (such as GDPR, HIPAA, SOC 2, ISO 27001), and ensure the uninterrupted availability of their critical applications.
The role of DevOps and SRE teams has evolved to manage this complexity, focusing on automation, observability, and rapid incident response. AI-driven operational tools, like the AWS DevOps Agent, are becoming indispensable in this landscape, automating routine tasks, predicting potential issues, and accelerating problem resolution. However, for these agents to operate effectively, they require access to a wide array of internal systems that often hold proprietary code, sensitive configuration data, or critical operational metrics. Exposing these internal systems to the public internet, even for an AI agent, is often deemed an unacceptable security risk, leading to operational friction and hindering the full potential of automation.
Private Connections for AWS DevOps Agent emerges as a timely solution to these challenges. By enabling secure, private connectivity, it empowers the agent to access necessary internal resources without compromising an organization’s security perimeter. This capability is not merely about connectivity; it’s about extending the reach of advanced operational intelligence into the most guarded parts of an enterprise network, thereby enhancing both security and operational efficiency. The feature reflects a broader industry trend towards "shift-left" security, integrating security considerations earlier and more deeply into the development and operations lifecycle, even for autonomous agents.
Under the Hood: How Private Connections Leverage Amazon VPC Lattice
At its core, Private Connections for AWS DevOps Agent establishes a secure network path between the agent’s operating environment and a designated target resource within a customer’s VPC or internal network. This sophisticated private connectivity is orchestrated through Amazon VPC Lattice, a fully managed application networking service. VPC Lattice simplifies the process of connecting, securing, and monitoring communication between applications across disparate VPCs, accounts, and compute types, abstracting away the complexities of underlying network infrastructure management.
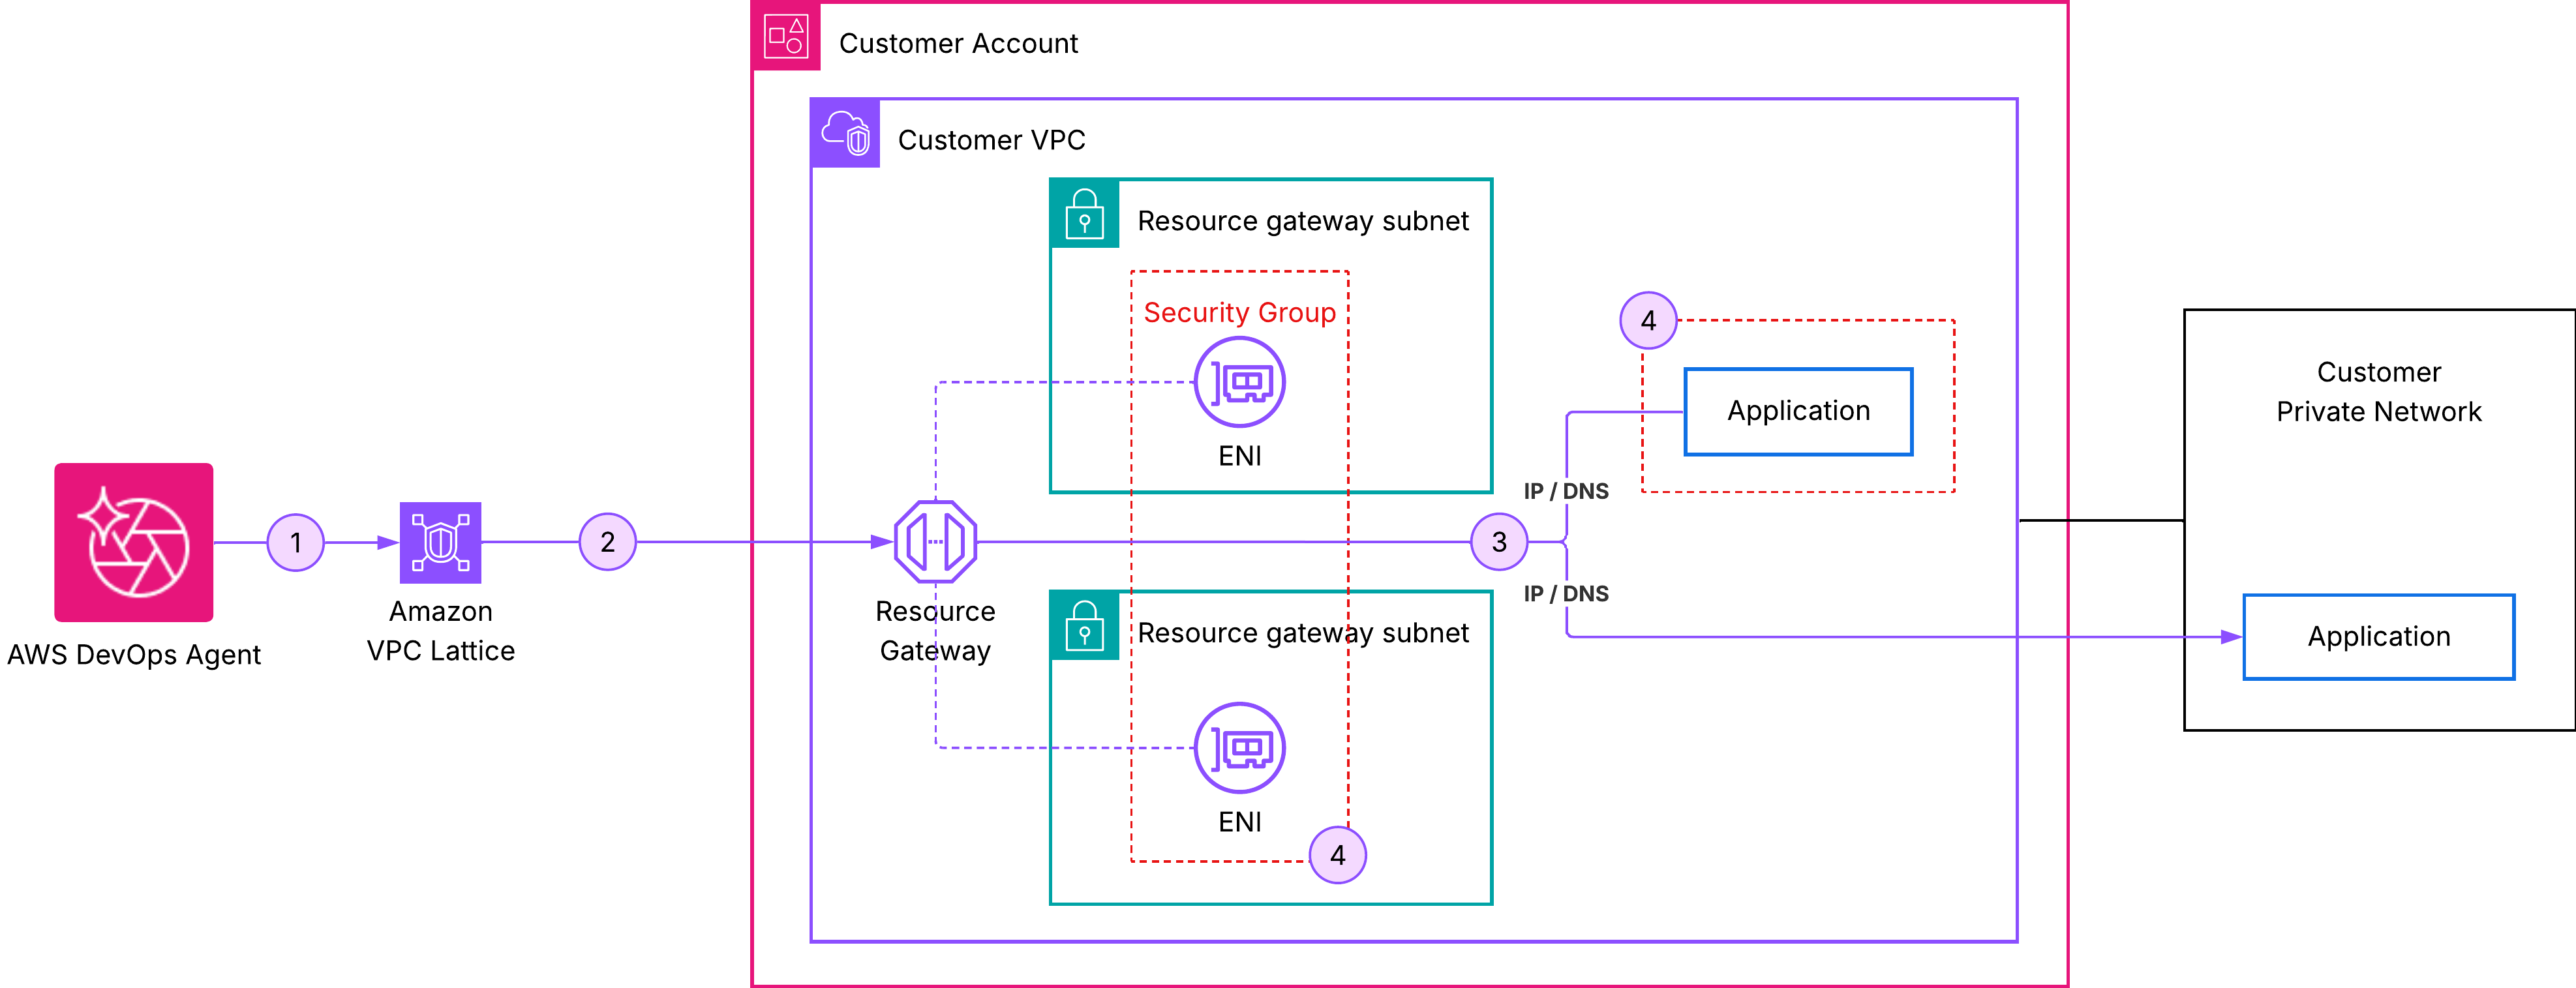
When a private connection is initiated, AWS DevOps Agent, in its service-managed mode, automatically provisions a dedicated "resource gateway." This gateway is a fully managed component, appearing as a read-only resource within the customer’s AWS account, requiring no direct configuration or maintenance from the user. The primary resources created within the customer’s VPC are Elastic Network Interfaces (ENIs) deployed in the subnets specified during the connection setup. These ENIs serve as the secure entry points for private traffic originating from the AWS DevOps Agent. Crucially, these ENIs are designed not to accept inbound connections from the public internet, thereby reinforcing the private nature of the connection. Customers retain full control over the traffic flowing to and from these ENIs through their existing security group configurations, allowing them to apply their established network access policies.
The process of establishing a private connection typically involves several key steps:
- Connection Request: A user initiates a private connection, providing details such as the connection name, the target host address, the VPC ID, specific subnet IDs, and relevant security group IDs.
- Resource Gateway Provisioning: AWS DevOps Agent, leveraging VPC Lattice, begins provisioning the necessary infrastructure, including the resource gateway and associated ENIs within the specified customer VPC subnets.
- Network Path Establishment: VPC Lattice establishes the secure, private network pathway, ensuring that traffic between the AWS DevOps Agent and the target resource remains entirely within the AWS network and the customer’s private infrastructure.
- Status Monitoring: The connection status transitions from
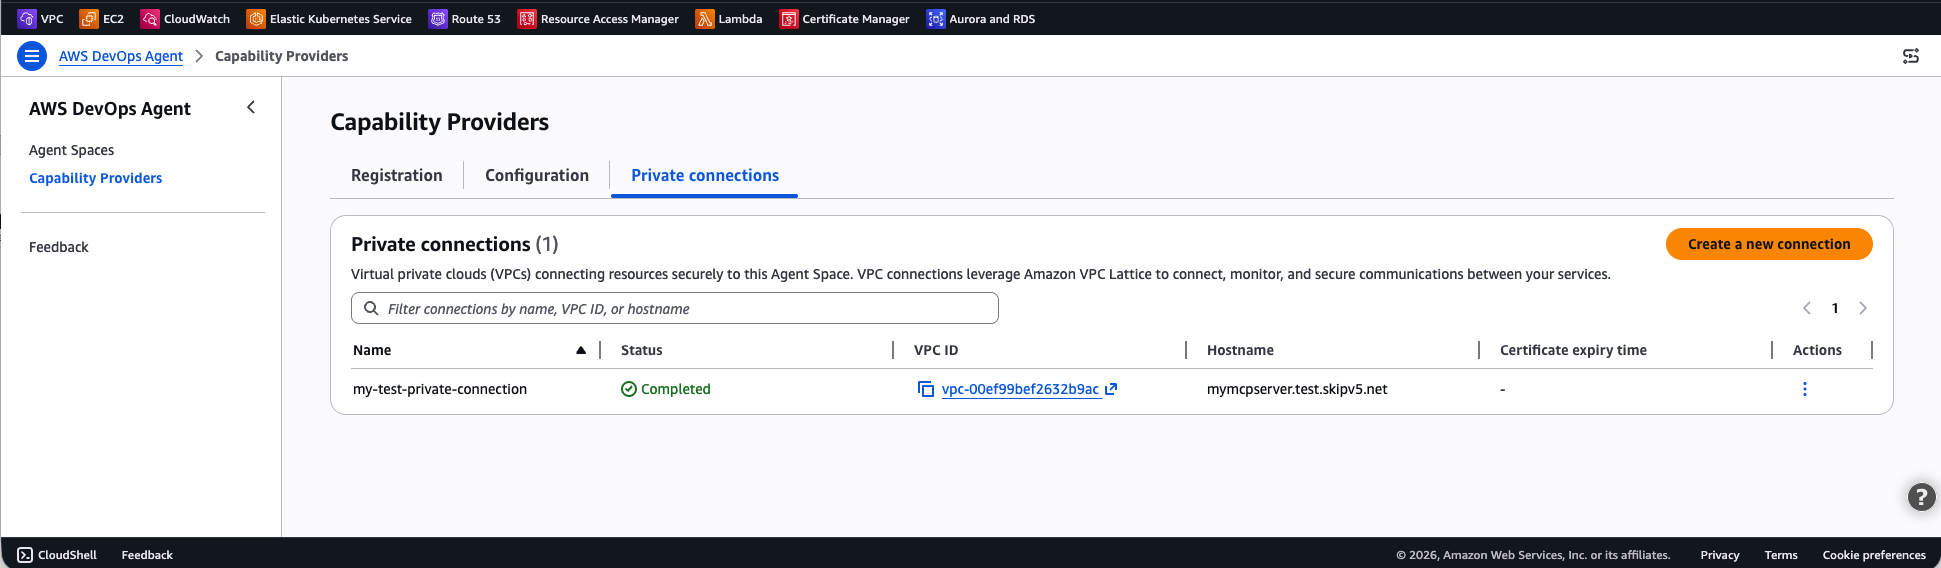
CREATE_IN_PROGRESStoCOMPLETEDonce the network path is fully established and operational, typically within minutes.
Multi-Layered Security Architecture
Security is paramount for any enterprise-grade cloud service, especially when dealing with critical operational tools and private networks. Private Connections for AWS DevOps Agent are engineered with multiple layers of security to ensure data confidentiality, integrity, and availability:
- Network Isolation: All traffic traversing a private connection remains entirely within the AWS network and the customer’s private VPC. It never traverses the public internet, eliminating a significant attack vector and mitigating risks associated with internet-borne threats.
- VPC Security Groups: Customers maintain complete control over network access to their target resources through their existing VPC security groups. This allows for granular, stateful packet filtering, ensuring that only authorized traffic reaches the private endpoints.
- IAM Access Control: Access to create, manage, and delete private connections is governed by AWS Identity and Access Management (IAM). This enables organizations to define precise permissions, ensuring that only authorized personnel and roles can configure connectivity to sensitive internal systems.
- Data Encryption: All communications over the private connection are encrypted in transit, protecting data from eavesdropping and tampering.
- Auditability: All actions related to private connections are logged in AWS CloudTrail, providing a comprehensive audit trail for security and compliance purposes. This allows organizations to monitor who accessed what, when, and from where, facilitating forensic analysis and adherence to regulatory requirements.
Organizations that manage their own resource configurations and utilize Service Control Policies (SCPs) within AWS Organizations should ensure that these policies permit VPC Lattice actions to allow for the seamless creation and management of private connections. This integration with existing AWS security frameworks ensures that private connections fit naturally into an enterprise’s overall security posture.
Architectural Overview: Visualizing the Private Pathway
The network path for a private connection is conceptually straightforward yet robust. Imagine the AWS DevOps Agent operating in its service environment, distinct from the customer’s private network. When the agent needs to interact with a privately hosted tool, the following sequence unfolds:
- Agent Initiates Request: The AWS DevOps Agent attempts to connect to a configured internal endpoint (e.g., a Grafana instance within a customer’s VPC).
- Private Connection Interception: The request is routed through the pre-established private connection.
- VPC Lattice Resource Gateway: The private connection directs traffic to a specialized resource gateway, managed by AWS DevOps Agent and built on VPC Lattice, residing within the AWS network but securely linked to the customer’s VPC.
- ENI as Entry Point: From the resource gateway, traffic flows securely to an Elastic Network Interface (ENI) that AWS DevOps Agent provisions in one of the customer’s designated private subnets within their VPC.
- Target Service Access: The ENI then forwards the traffic to the actual target service (e.g., the self-hosted Grafana instance, an MCP server, or a private package registry) within the customer’s VPC, respecting the security group rules applied to that ENI and the target service.
An important technical nuance lies in how DNS resolution and host routing operate. When creating a private connection, the "host address" provided (e.g., my-alb.us-east-1.elb.amazonaws.com) is the DNS name that VPC Lattice resolves to route traffic to the customer’s target. This DNS name must be publicly resolvable, even if it ultimately resolves to private IP addresses. Conversely, when a service integration is registered with AWS DevOps Agent, the "endpoint URL" (e.g., https://my-grafana.internal.corp) is used for the Host header and Service Name Indicator (SNI) on the TLS connection, but not for DNS resolution. This separation offers significant flexibility, allowing multiple service integrations to point to the same private connection and, consequently, the same target (such as an Application Load Balancer), while each integration uses a distinct endpoint hostname. The target service can then leverage the Host header to route requests to different backend services or applications. For example, a single private connection could be configured with an ALB’s DNS name as the host address, while separate Grafana and MCP server integrations, each with their unique internal endpoint URLs, would share this connection, with the ALB performing host-based routing to direct requests appropriately.
Prerequisites and Setup: A Guided Overview
Before an organization can leverage private connections, several prerequisites must be met to ensure a smooth and secure integration:
- Existing VPC: A properly configured Amazon Virtual Private Cloud (VPC) where the target services reside.
- Available Subnets: At least two private subnets within the VPC with sufficient available IP addresses for the deployment of ENIs. These subnets should have routes to the target service.
- Security Group: A security group configured to allow inbound traffic from the ENIs that AWS DevOps Agent will create on the specified ports to the target service.
- IAM Permissions: Appropriate AWS IAM permissions for the user or role creating the private connection, allowing the creation and management of related VPC Lattice resources.
- VPC Lattice Quotas: Ensure the AWS account has not reached its VPC Lattice service quotas for resource configurations or service network associations.
Private connections are established as account-level resources, meaning that once created, a single private connection can be reused across multiple integrations and Agent Spaces that need to reach the same host. This promotes efficiency and reduces administrative overhead.
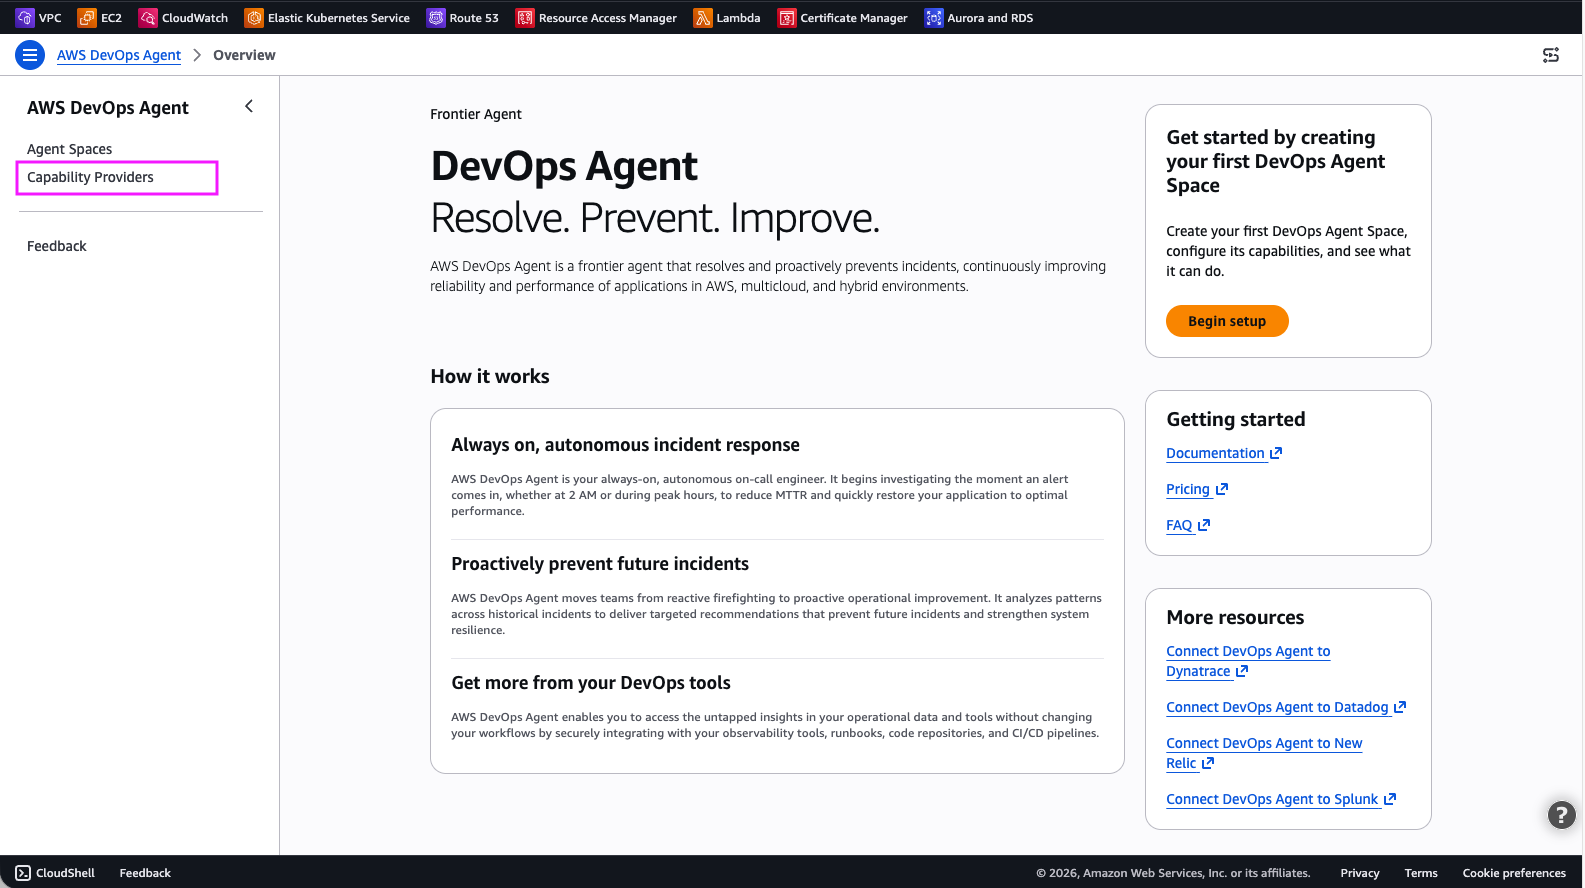
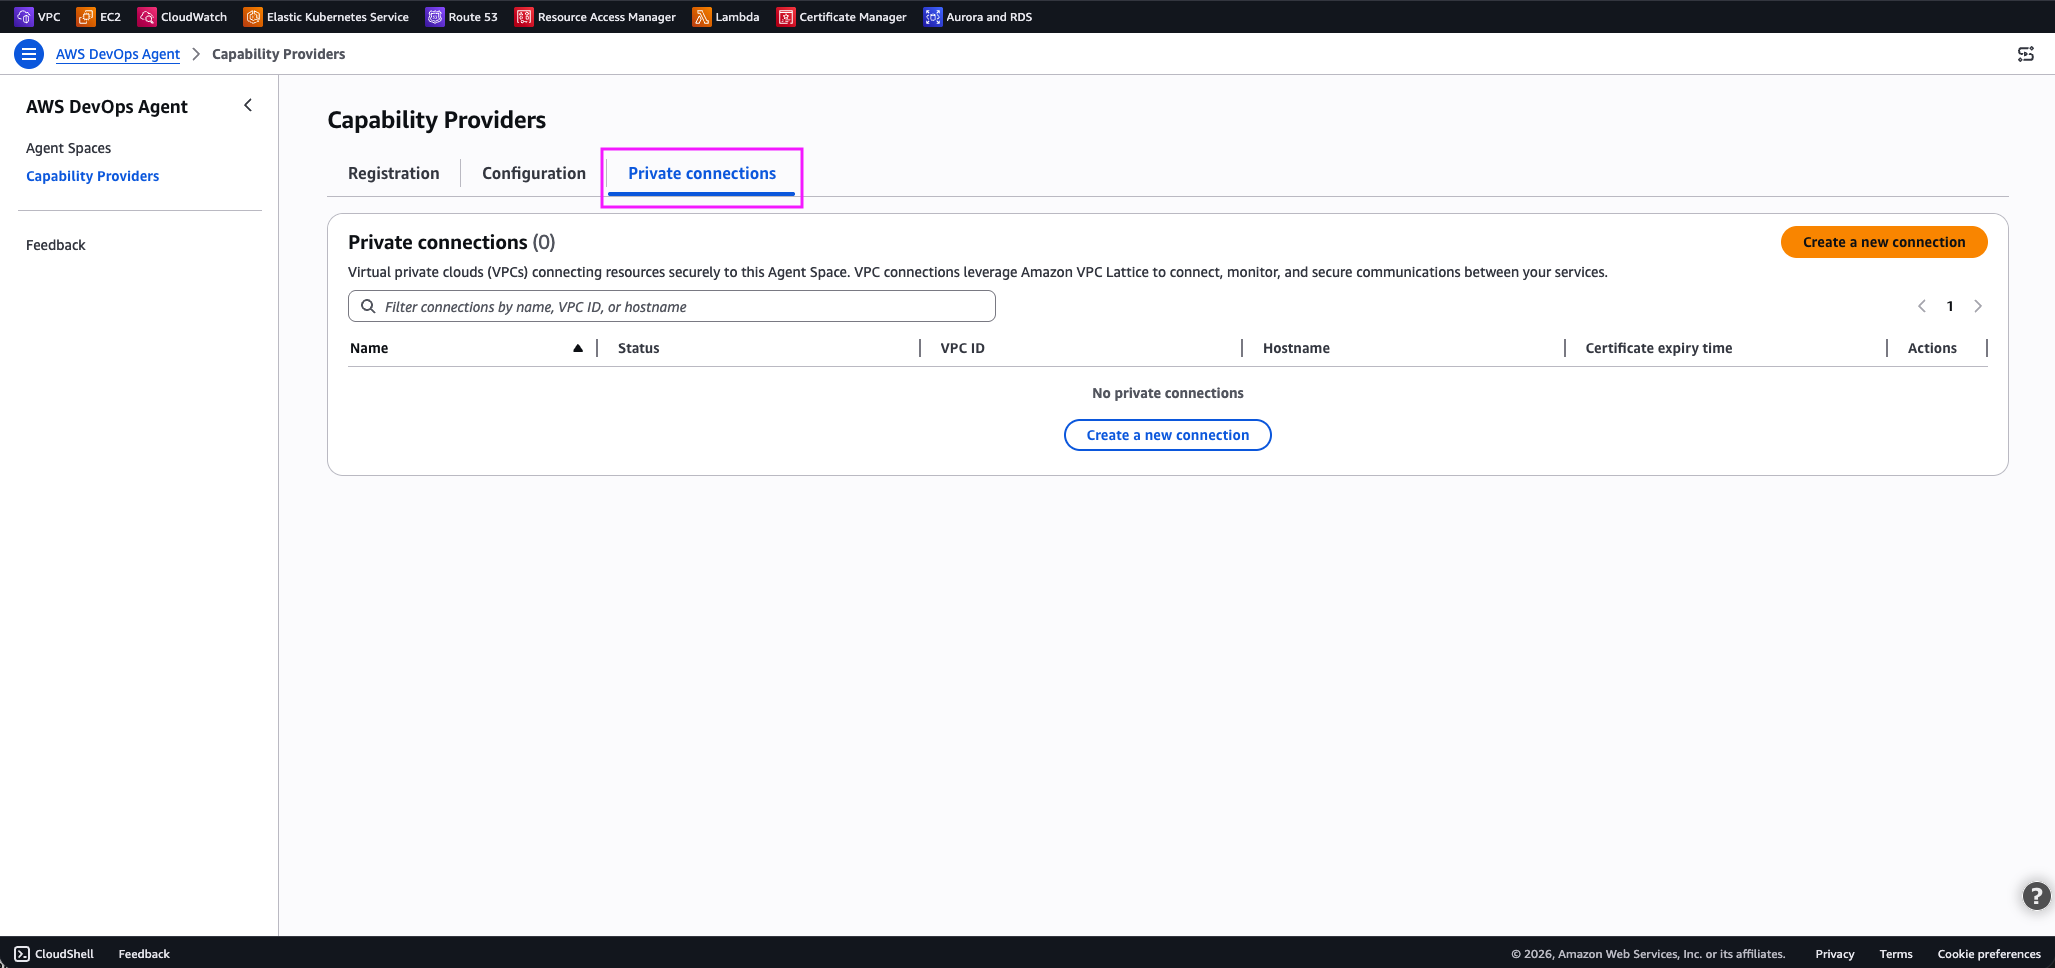
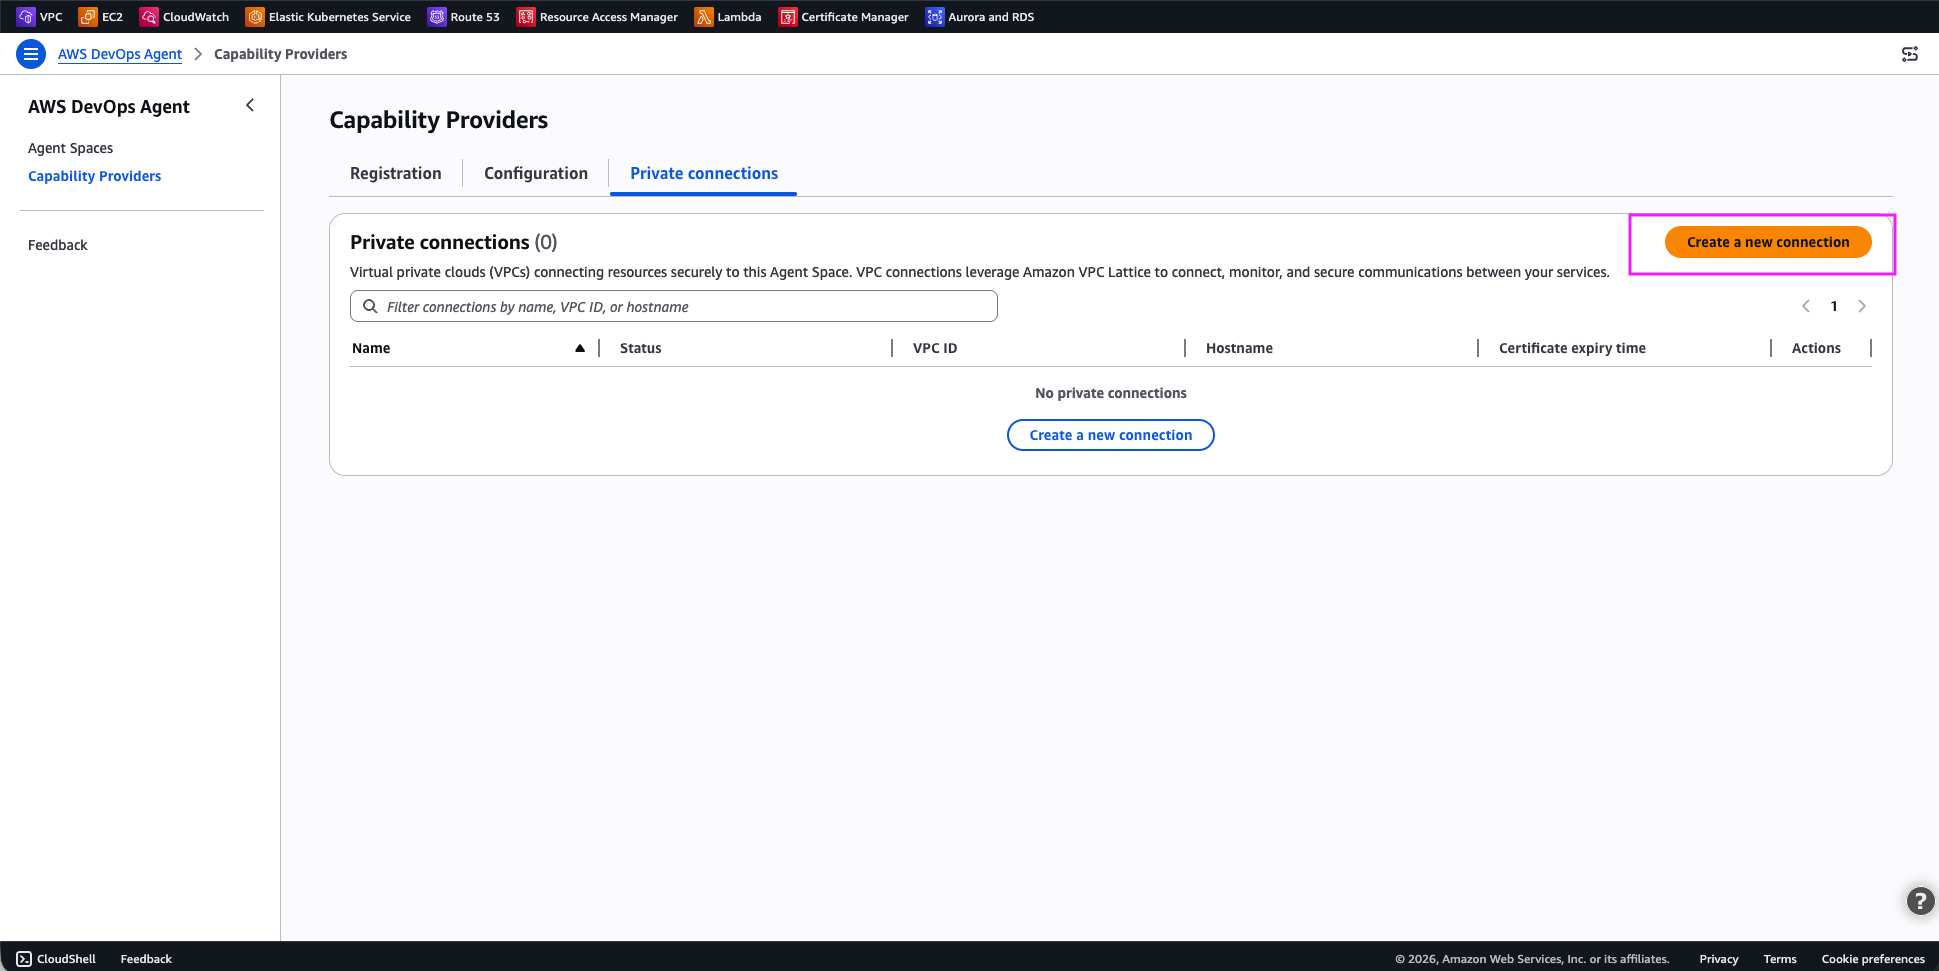
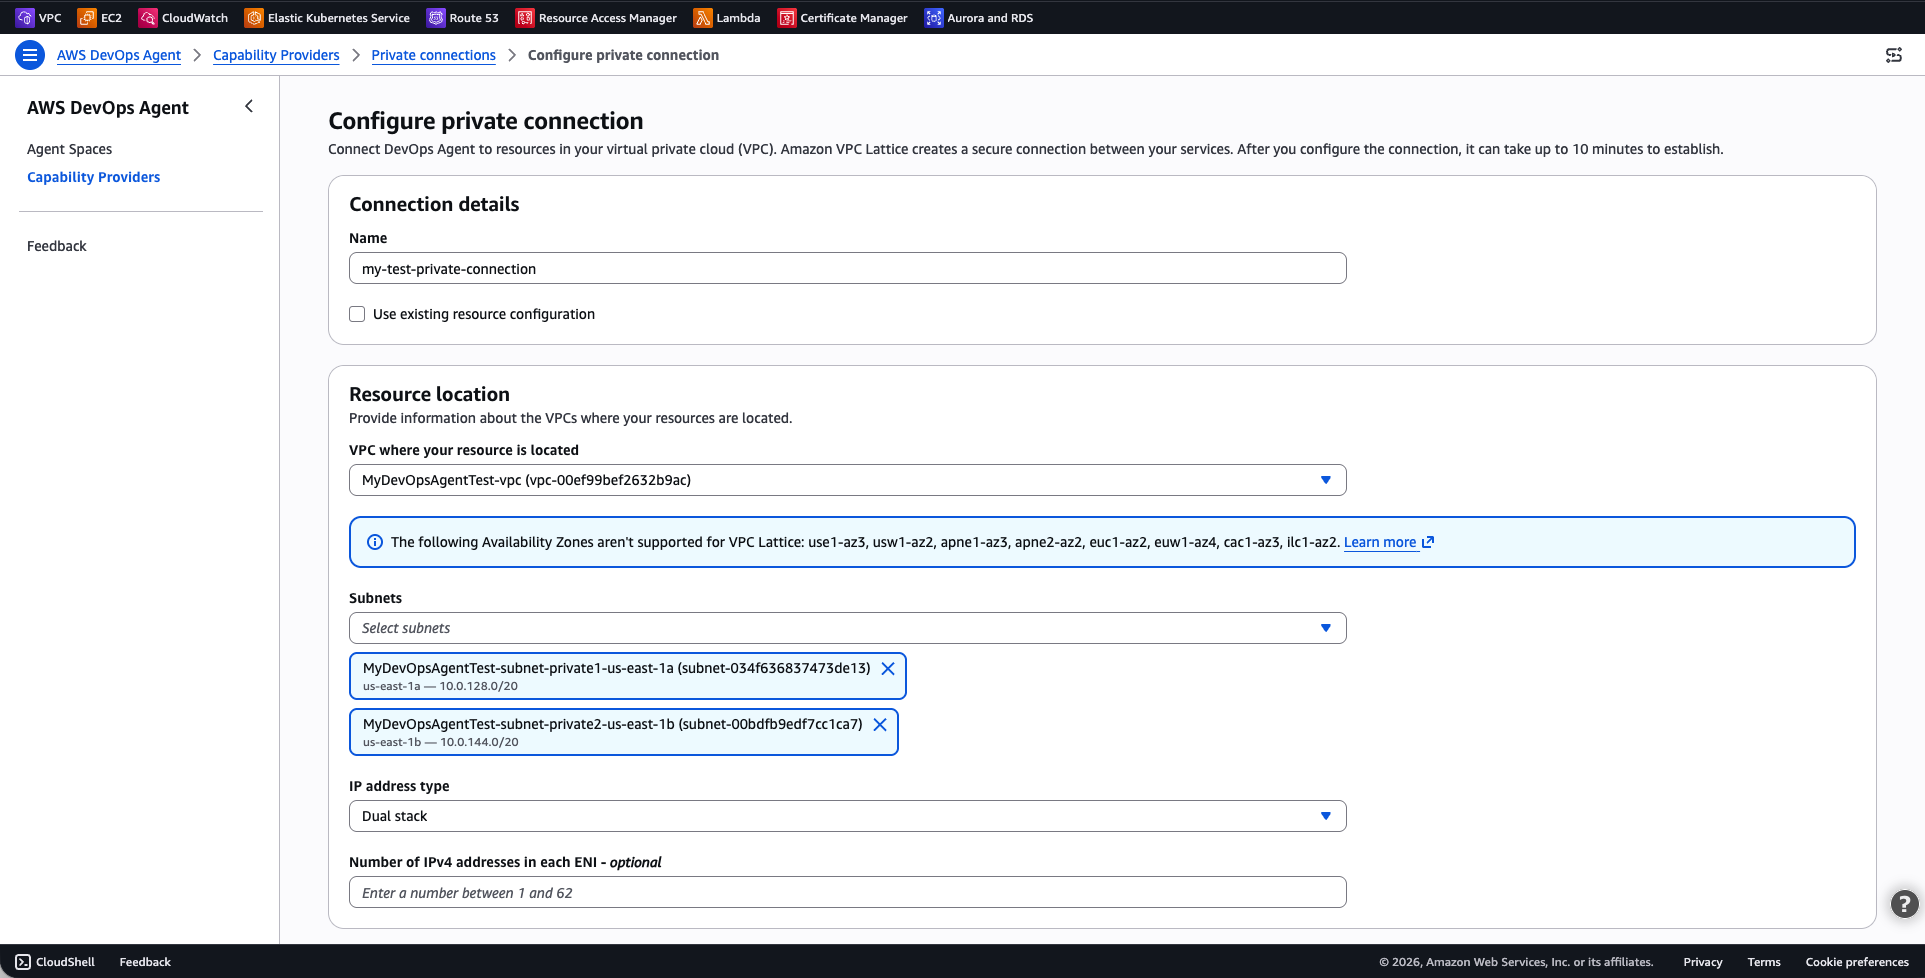
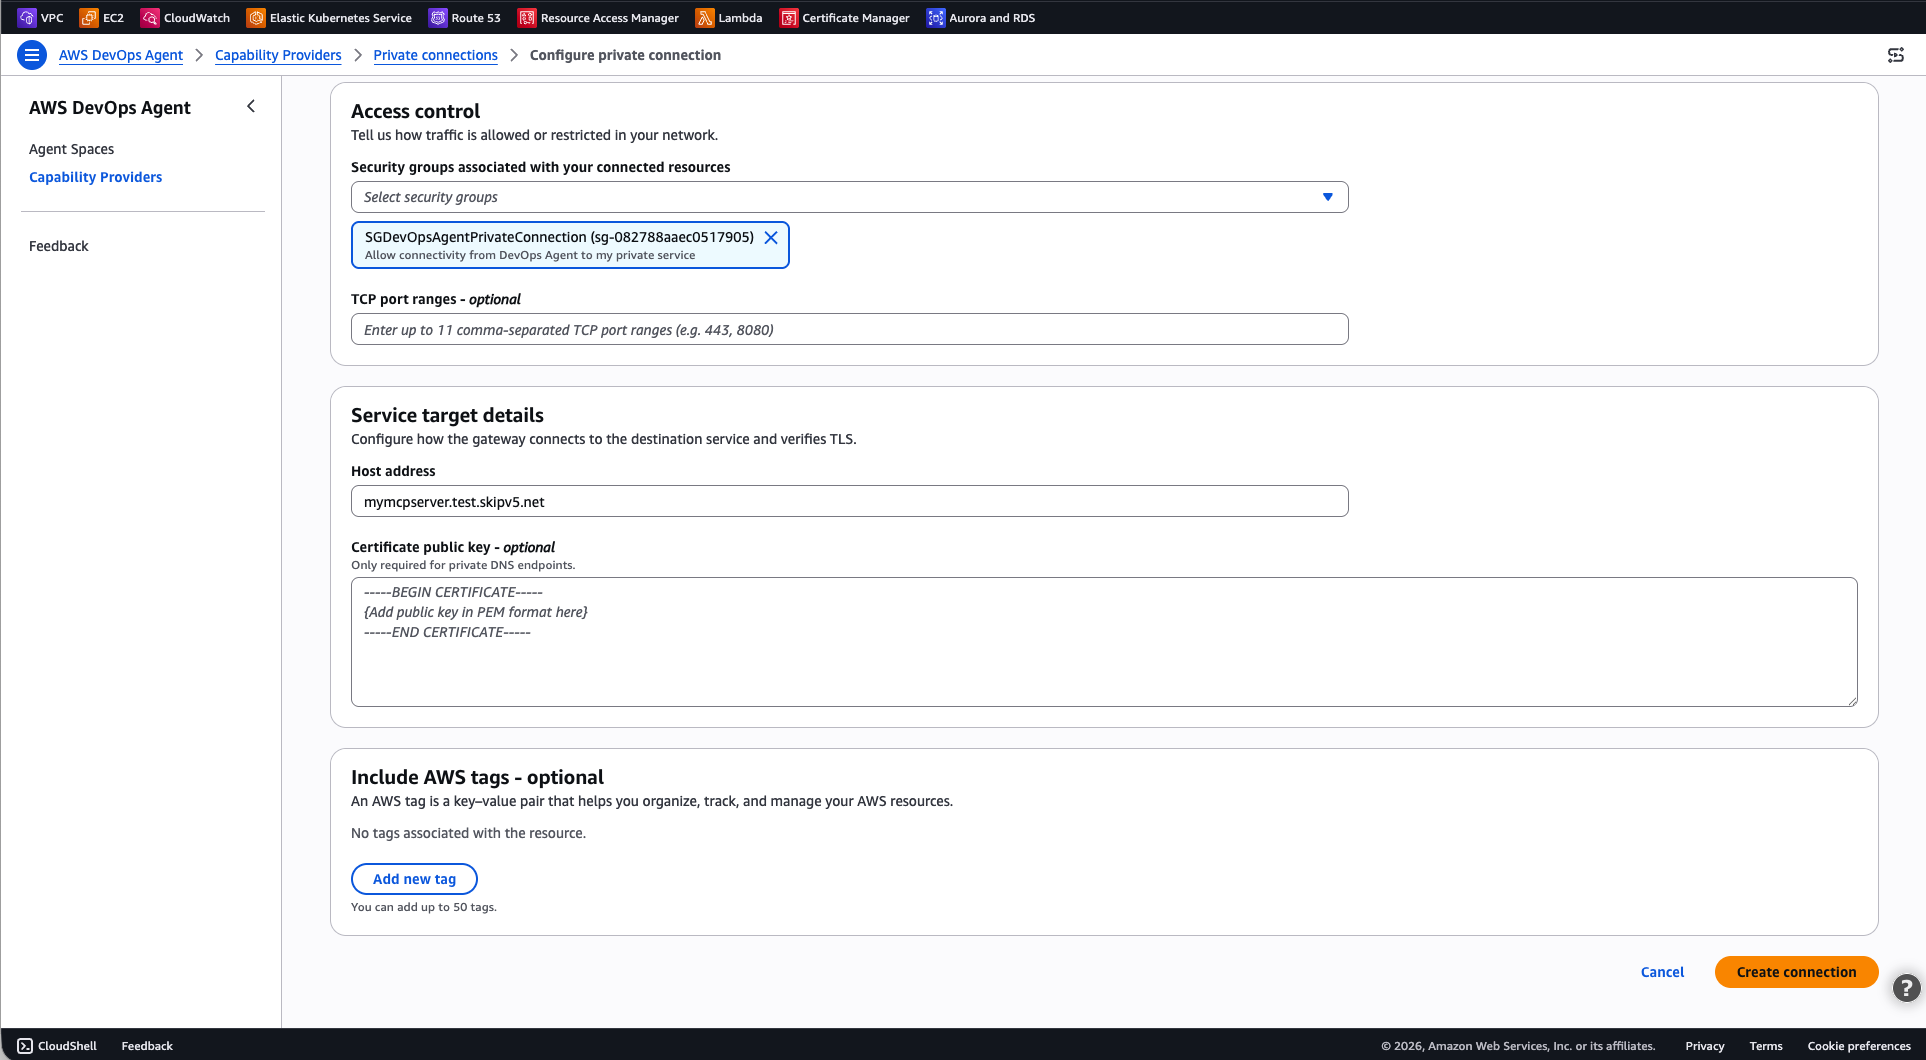
Setting up a private connection can be accomplished through either the AWS Management Console or the AWS Command Line Interface (CLI). Through the console, users navigate to the AWS DevOps Agent section, select "Capability providers," then "Private connections," and initiate the "Create a new connection" workflow. This guided process involves configuring connection details (name), resource location (VPC ID, subnets, security groups), access control, and service target details (host address, port ranges). The CLI offers a programmatic approach, using commands like aws devops-agent create-private-connection with JSON parameters specifying the connection’s mode, host address, VPC details, and security configurations. Both methods provide status updates, indicating CREATE_IN_PROGRESS until the connection is COMPLETED.
Upon successful creation, verifying the connection is crucial. This typically involves registering a test service integration with the AWS DevOps Agent that points to a known endpoint reachable via the private connection. If the agent successfully interacts with this test service, the private connection is validated. Troubleshooting steps, if needed, include checking security group rules, network ACLs, DNS resolution, and ensuring the target service is operational and accessible from within the VPC.
Real-World Application: Integrating with a Self-Hosted Grafana Instance
One of the most compelling and common use cases for private connections is integrating AWS DevOps Agent with a self-hosted Grafana instance. Many enterprises run Grafana within a private VPC, intentionally without public endpoints, to visualize critical metrics, logs, and traces from their applications and infrastructure. This isolation ensures that sensitive operational data remains protected. With Private Connections, AWS DevOps Agent can gain read-only access to these Grafana dashboards, alerts, and data sources, mirroring the observability capabilities relied upon by on-call engineers during incidents.
AWS DevOps Agent provides a dedicated Grafana integration that hosts the official open-source Grafana MCP server on behalf of the customer, abstracting the need to deploy or manage this server infrastructure. This integration supports Grafana Cloud, Grafana Enterprise, and self-hosted Grafana OSS (version 9.1 and later). For self-hosted instances that are not publicly accessible, pairing this integration with a private connection is essential.
The integration process involves:
- Creating a Grafana Service Account: Within the Grafana instance, an administrator creates a service account with "Viewer" role permissions, granting read-only access to dashboards, alert rules, and data sources. An access token is generated for this service account, which is then securely stored.
- Establishing a Private Connection to Grafana: A private connection is created, specifying the Grafana instance’s internal address (e.g.,
grafana.internal.example.com) as the host address, along with the relevant VPC, subnet, and security group details. This establishes the secure, private network path. - Adding the Grafana Integration to Agent Space: Once the private connection is
COMPLETED, the Grafana service is registered with the AWS DevOps Agent. This involves providing the Grafana instance’s endpoint URL and the previously generated service account token. The integration is then associated with the Agent Space, allowing the agent to route traffic to the Grafana instance via the newly created private connection, matching on the host address.
To verify the integration, users can interact with the agent in their Agent Space, asking questions like "Summarize my recent Grafana alerts." If the agent successfully retrieves and presents alert data from the dashboards, both the private connection and the Grafana integration are functioning correctly. Additionally, organizations can configure webhook contact points within Grafana to send alert notifications directly to the Agent Space’s webhook URL, enabling the agent to automatically initiate investigations when alerts trigger, correlating Grafana data with other resources in the Agent Space.
Advanced Configurations: Leveraging Existing VPC Lattice Resources
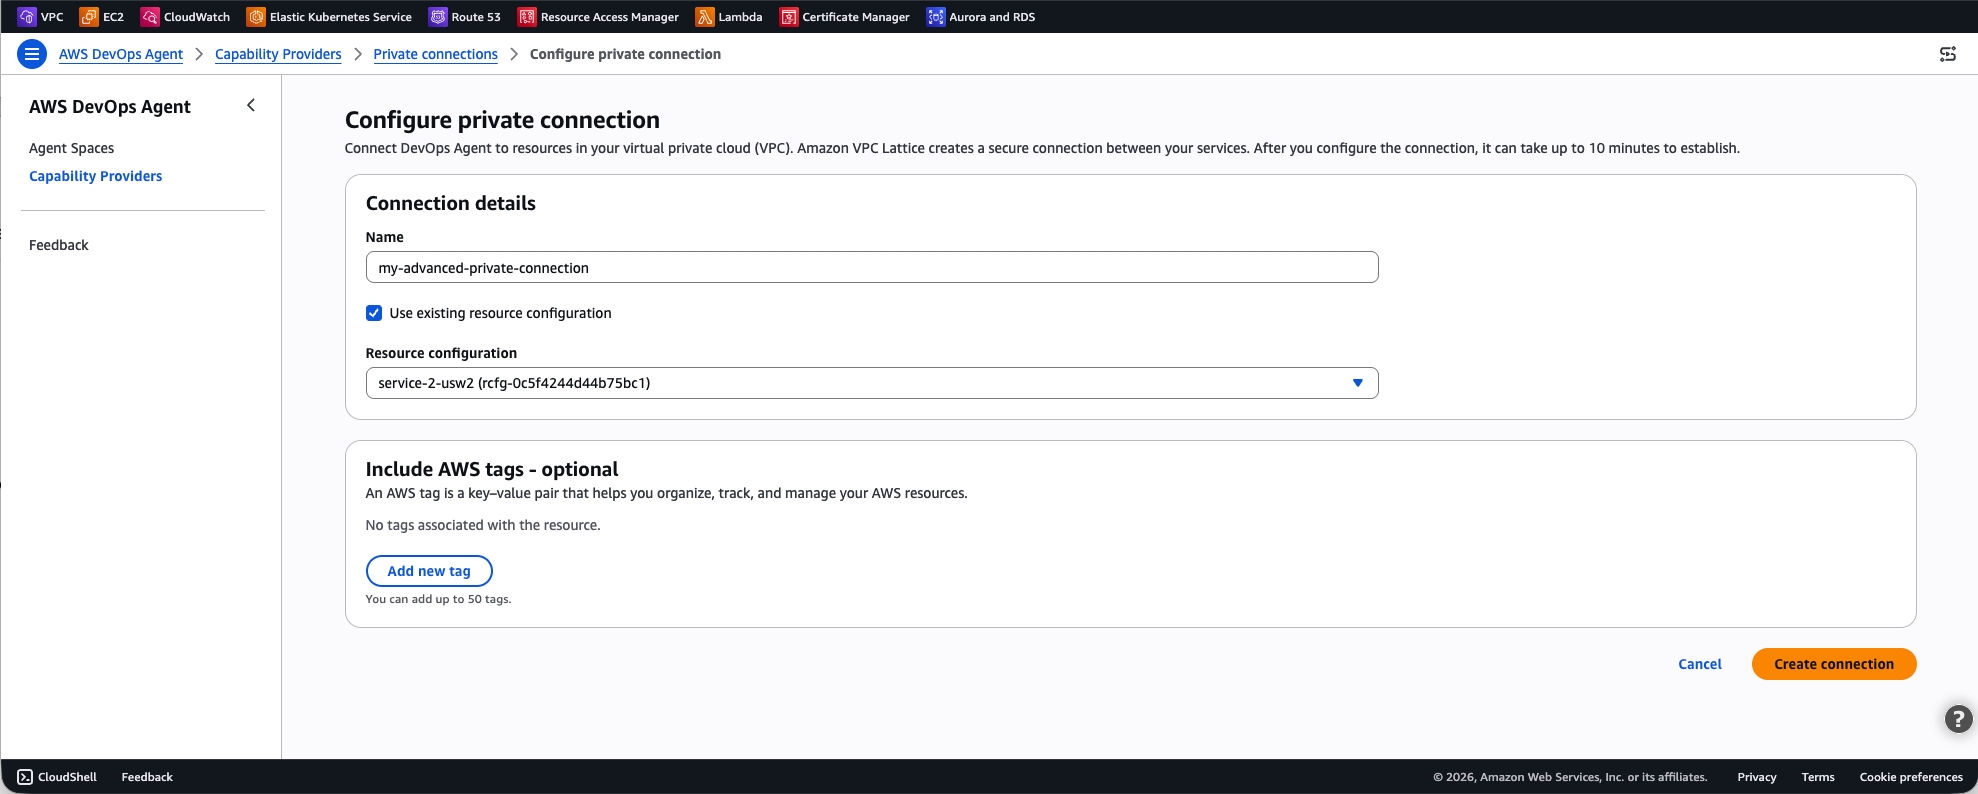
For organizations that have already adopted Amazon VPC Lattice and manage their own resource configurations, AWS DevOps Agent offers an "self-managed" mode for private connections. In this advanced setup, instead of having AWS DevOps Agent create a new resource gateway, customers provide the Amazon Resource Name (ARN) of an existing VPC Lattice resource configuration that points to their target service.
This approach is particularly beneficial for scenarios where:

- Centralized VPC Lattice Management: The organization has a centralized team responsible for managing VPC Lattice deployments and network configurations.
- Complex Routing Requirements: The target service involves intricate routing rules or integrations that are already handled by an existing VPC Lattice setup.
- Specific Compliance or Security Policies: Existing VPC Lattice configurations already adhere to specific compliance standards or granular security policies that the organization wishes to maintain.
- Resource Sharing: The existing VPC Lattice configuration is shared across multiple accounts or services within the organization.
The self-managed mode allows organizations to seamlessly integrate AWS DevOps Agent into their pre-existing VPC Lattice infrastructure, providing flexibility and leveraging established network management practices. This configuration can be set up via the AWS Console by selecting "Use existing resource configuration" or through the AWS CLI by specifying the selfManaged mode and providing the resourceConfigurationId.
Broader Implications and Future Outlook
The introduction of Private Connections for AWS DevOps Agent marks a significant milestone in enabling secure, intelligent operations for enterprises. The implications are far-reaching:

- Enhanced Security Posture: By eliminating public internet exposure for critical internal tools, organizations can significantly strengthen their security posture, reducing the attack surface and mitigating risks of data breaches or unauthorized access. This aligns with stringent compliance requirements across various industries.
- Improved Operational Efficiency: SRE and DevOps teams can fully unleash the potential of the AWS DevOps Agent, allowing it to access a comprehensive range of internal data sources for incident prevention, resolution, and performance optimization. This accelerates MTTR and reduces manual intervention, freeing up valuable engineering time.
- Accelerated Agentic AI Adoption: The ability to securely connect to private enterprise systems is a crucial enabler for the broader adoption of AI-driven operational tools. It builds trust and confidence in using autonomous agents for critical tasks, paving the way for more sophisticated, self-healing, and self-optimizing systems.
- Seamless Hybrid and Multi-Cloud Integration: Private Connections further solidifies AWS’s commitment to supporting complex hybrid and multi-cloud strategies, ensuring that operational intelligence can seamlessly span diverse computing environments without compromising security or performance.
- Expanded Ecosystem of Integrations: This feature opens the door for a richer ecosystem of custom tools and integrations, allowing organizations to tailor the AWS DevOps Agent to their unique operational needs and leverage proprietary data sources for more precise and effective automation.
To begin harnessing these capabilities, organizations are encouraged to explore the AWS DevOps Agent console and create their first private connection. For comprehensive guidance and detailed documentation, the AWS DevOps Agent User Guide provides extensive resources on private connections and other advanced features. This innovation represents a crucial step towards truly autonomous, secure, and highly efficient cloud operations, empowering enterprises to navigate the complexities of modern IT with greater confidence and agility.
Related posts: