
Skyroot Aerospace Achieves Historic Milestone as Vikram-1 Becomes India’s First Privately Developed Rocket to Reach Orbit on Debut Flight
The Indian space sector reached a transformative milestone on Saturday as Skyroot Aerospace successfully launched its Vikram-1 rocket into low-Earth orbit, marking the first time a privately developed Indian launch vehicle has achieved orbital velocity on its inaugural attempt. The mission, which lifted off from the Satish Dhawan Space Center on Sriharikota Island, was hailed by both government officials and industry experts as a "grand success," signaling India’s emergence as a major player in the global commercial launch market. Reaching a targeted altitude of approximately 280 miles (450 kilometers), the Vikram-1 demonstrated the precision of its multi-stage propulsion system and the viability of India’s burgeoning private space ecosystem.
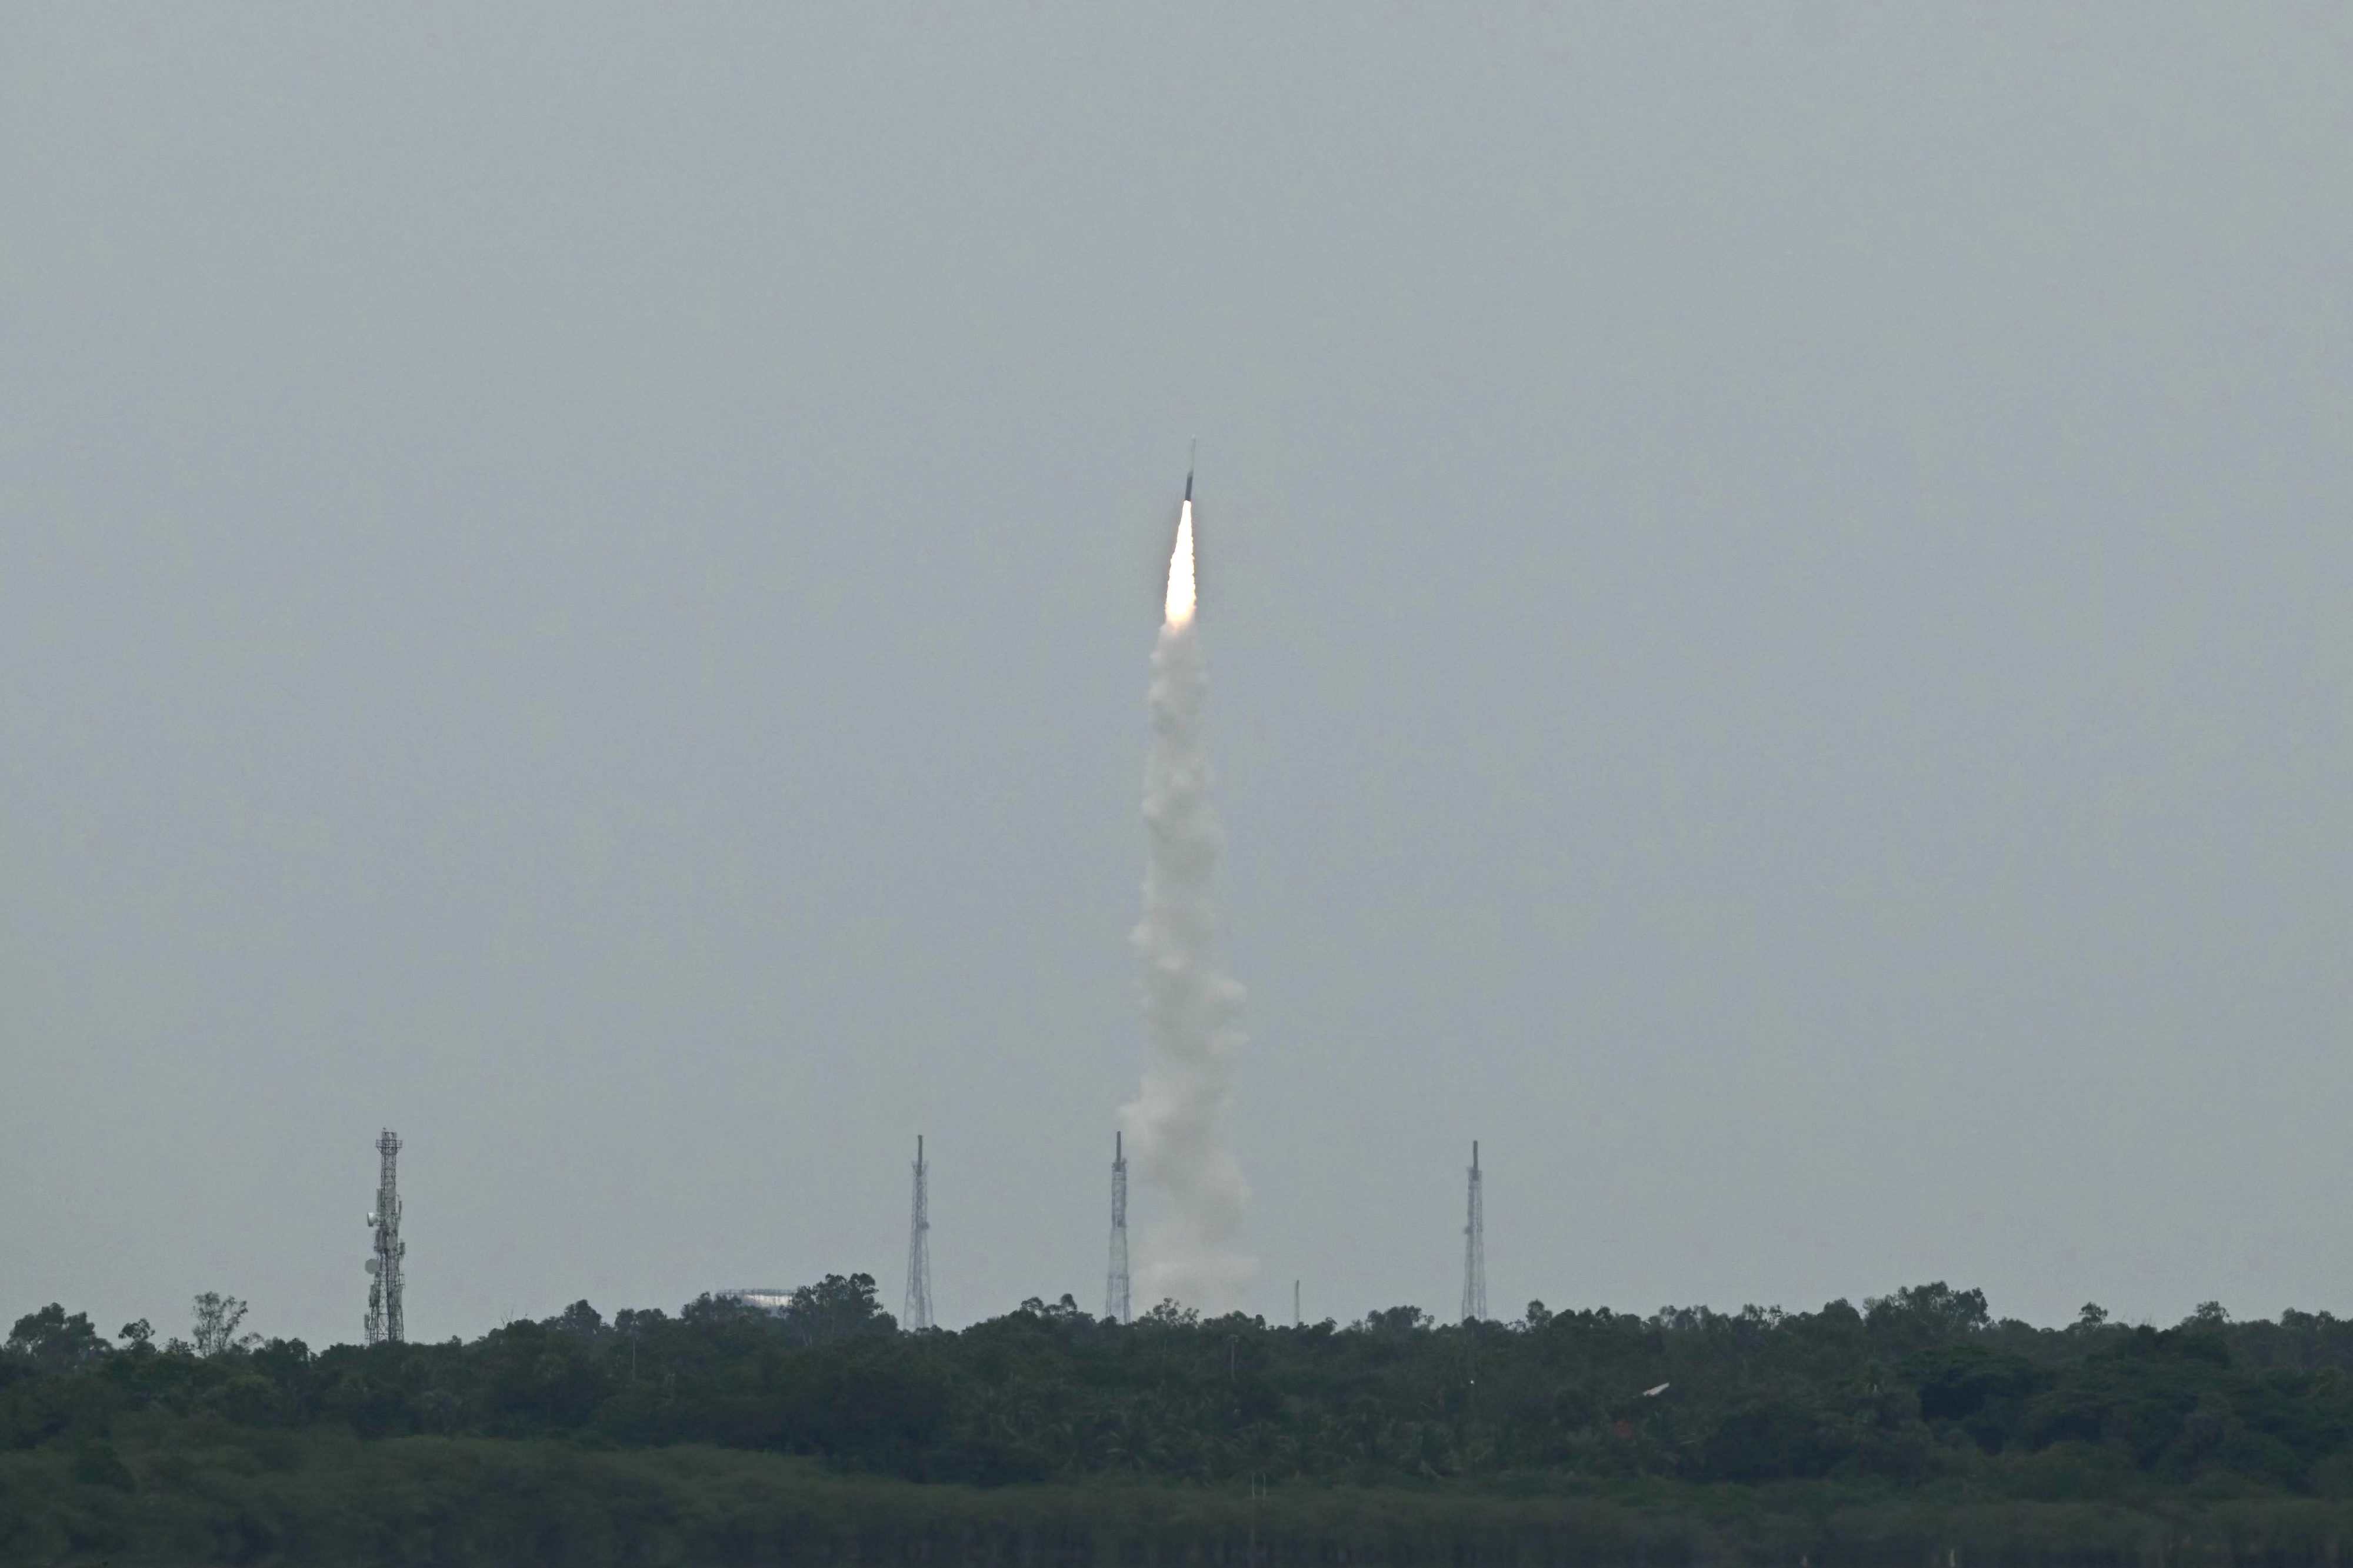
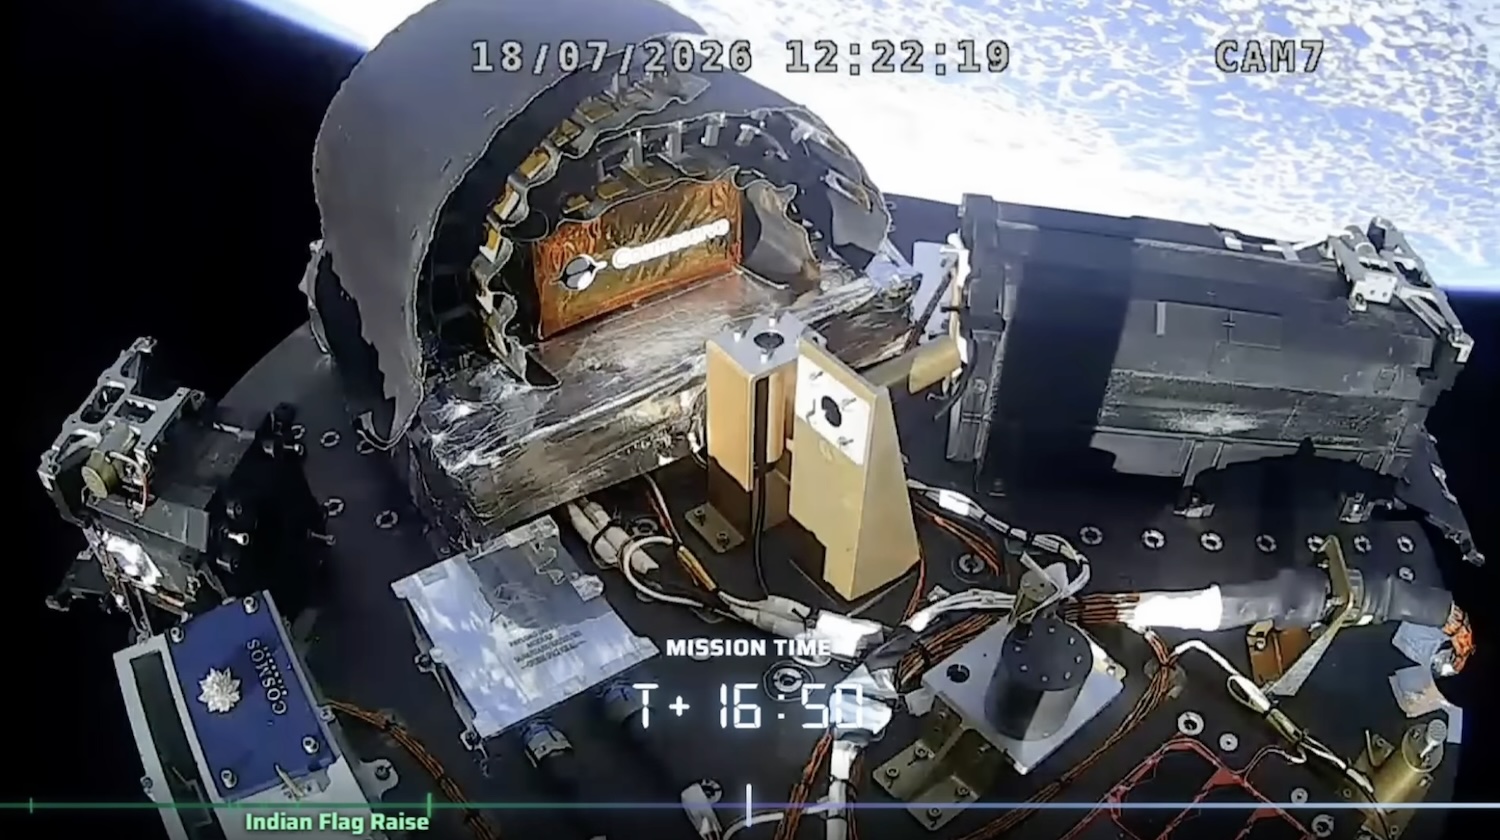
The flight began at 1:35 am EDT (06:35 UTC) following a brief 30-minute technical delay during the final countdown. Once the "go" command was given, the rocket’s solid-fueled first stage ignited, propelling the 72-foot (22-meter) tall vehicle off the launch pad and into the clear skies over the Bay of Bengal. The ascent was monitored closely by the Indian Space Research Organization (ISRO) and Skyroot’s mission control, with live onboard camera feeds providing real-time verification of stage separations and engine ignitions.
Technical Specifications and Mission Profile
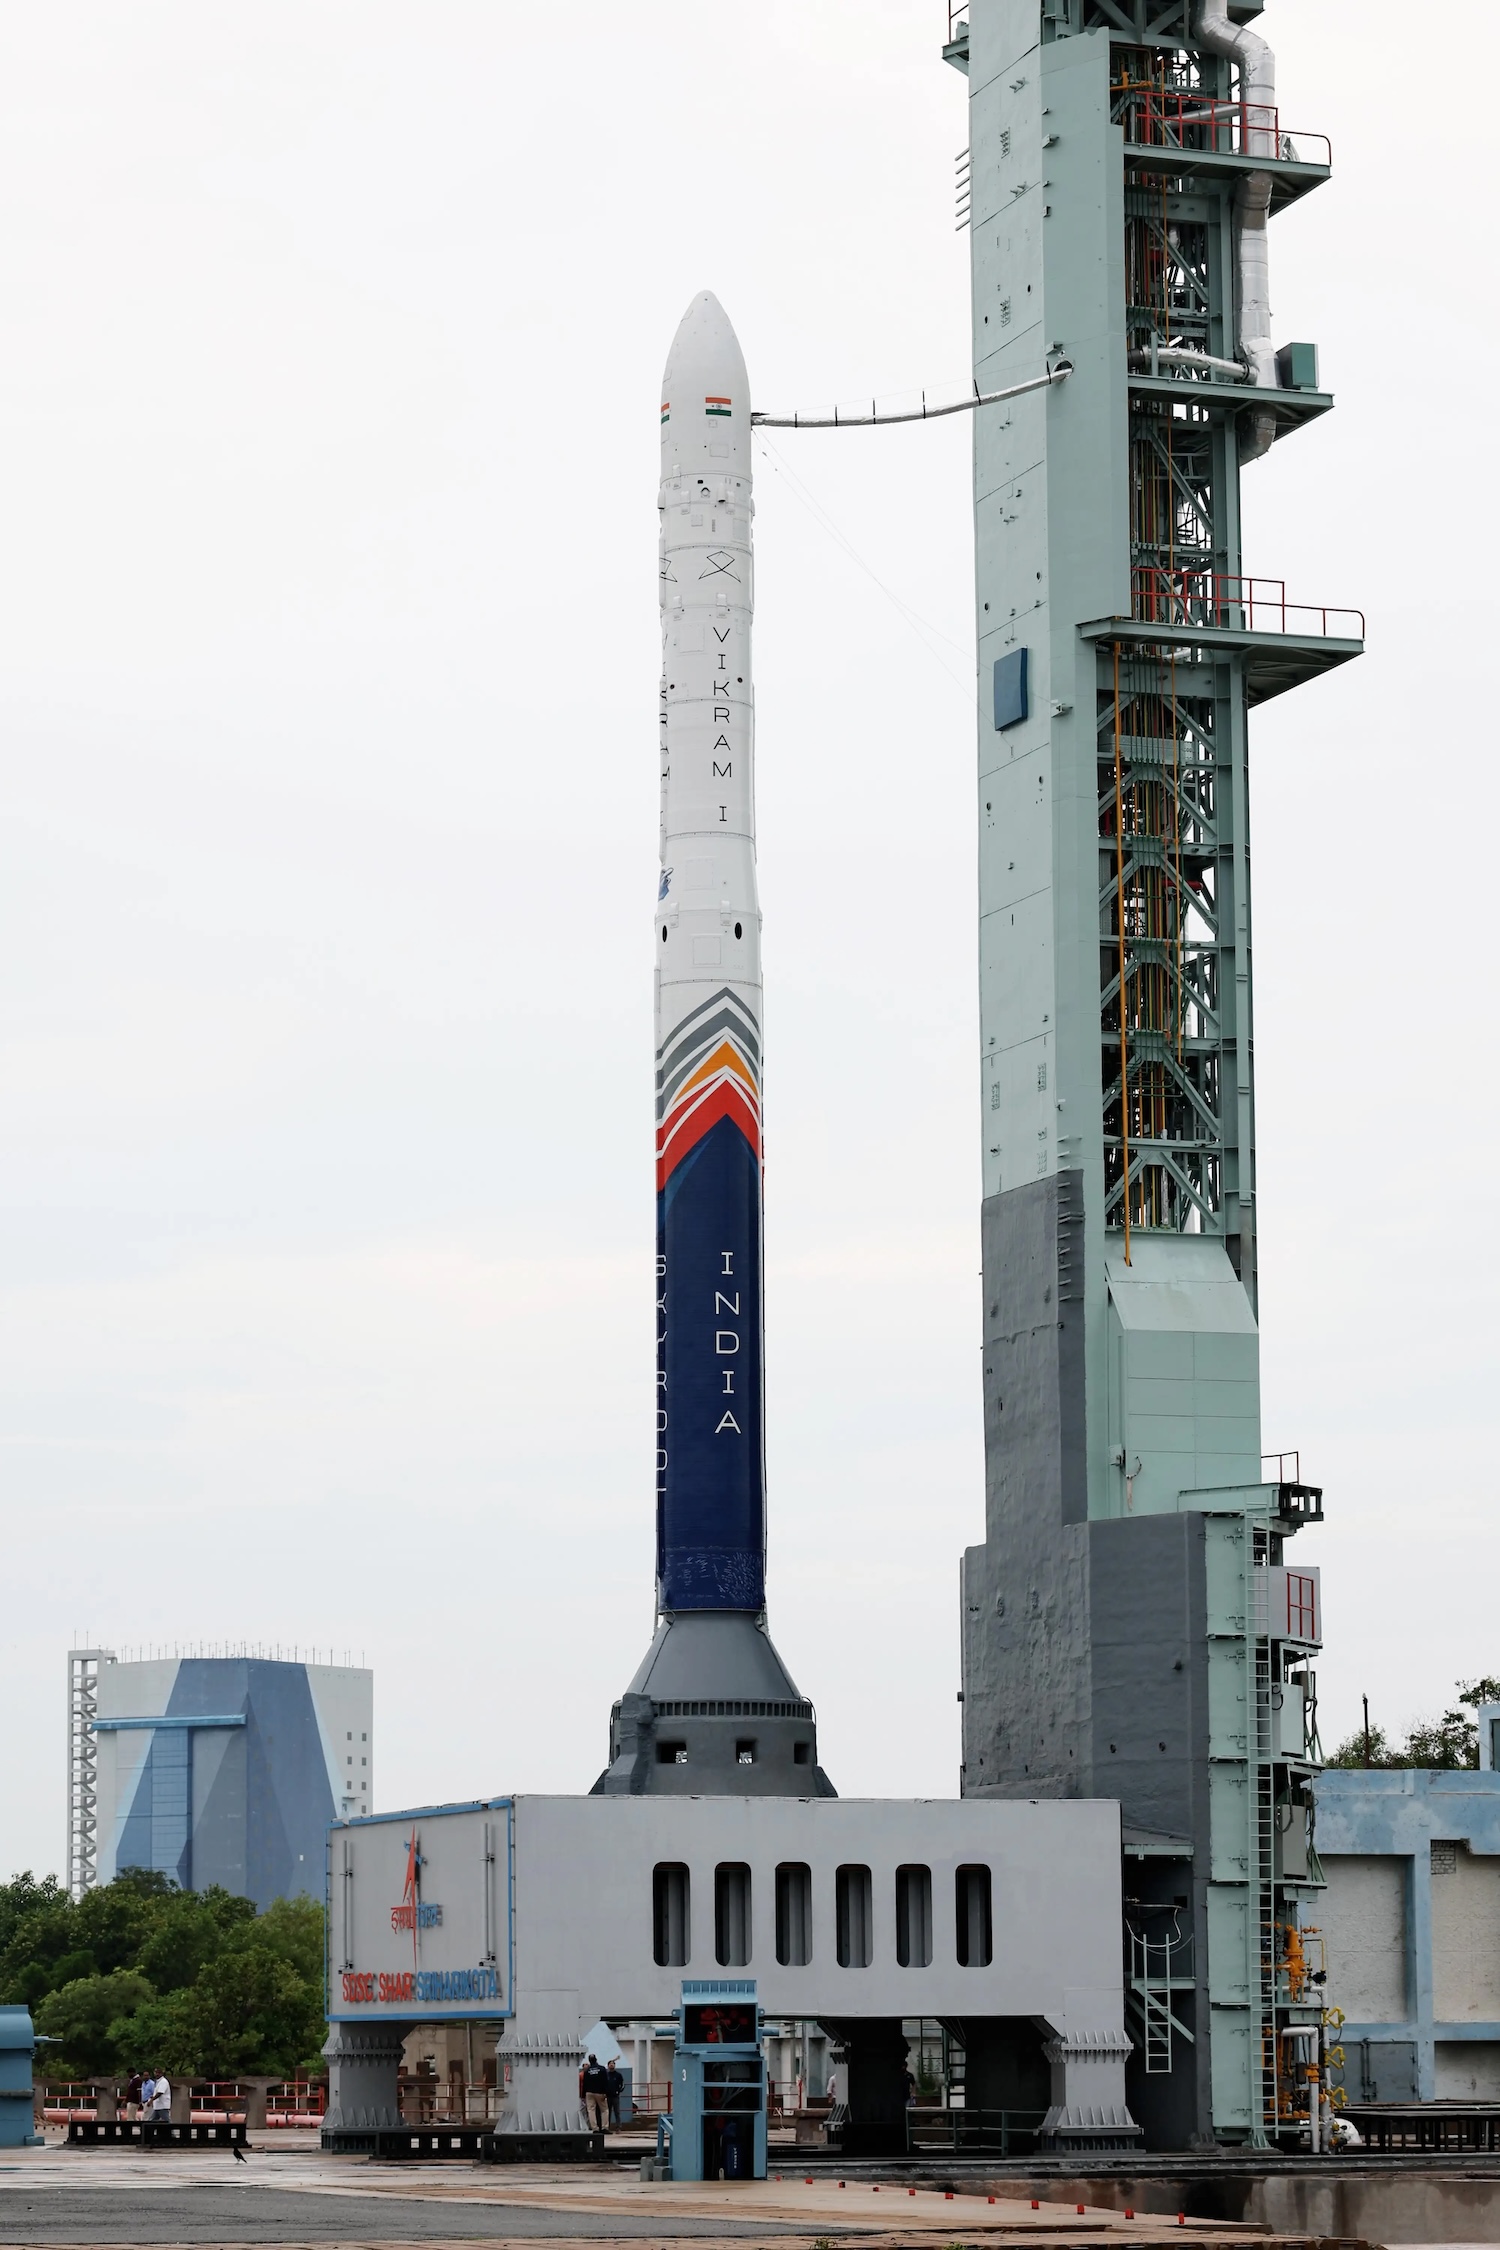
The Vikram-1 is a four-stage launch vehicle designed specifically to cater to the rapidly growing small-satellite market. Named in honor of Dr. Vikram Sarabhai, the visionary physicist regarded as the father of the Indian space program, the rocket is constructed primarily from high-strength, lightweight carbon composite materials. This advanced construction allows for a high mass-to-payload ratio, enabling the vehicle to carry up to 770 pounds (350 kilograms) to low-Earth orbit (LEO).
Technically, the Vikram-1 utilizes a hybrid propulsion strategy. The first three stages are powered by solid-fueled rocket motors, which provide the high thrust necessary to escape the densest layers of Earth’s atmosphere. The fourth and final stage features a liquid-fueled engine, which was manufactured using 3D-printing technology. This upper stage is responsible for the final "kick" into orbit and precise payload deployment.
During Saturday’s flight, the rocket followed a near-perfect trajectory. After the three solid stages exhausted their fuel and separated, the vehicle entered a brief coasting phase. Analysts noted a minor anomaly during the separation of the third and fourth stages, where the spent motor appeared to linger near the upper stage rather than drifting away immediately. However, this did not impede the mission; the 3D-printed liquid engine ignited as scheduled, accelerating the craft to an orbital velocity of approximately 17,000 mph. US military tracking data later confirmed that the rocket reached an orbit of 280 miles at an inclination of 60 degrees, aligning almost perfectly with pre-flight predictions.
Chronology of a Historic Launch
The success of Vikram-1 was the culmination of years of intensive development and testing. The timeline of the mission’s success can be traced back to the founding of Skyroot Aerospace and several key milestones:
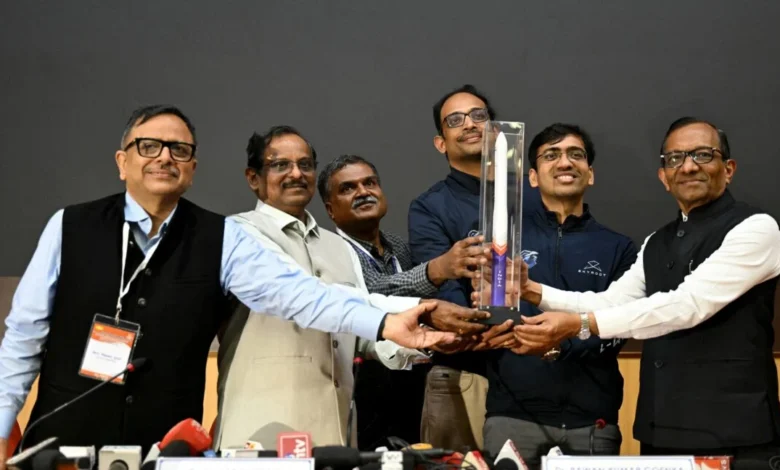
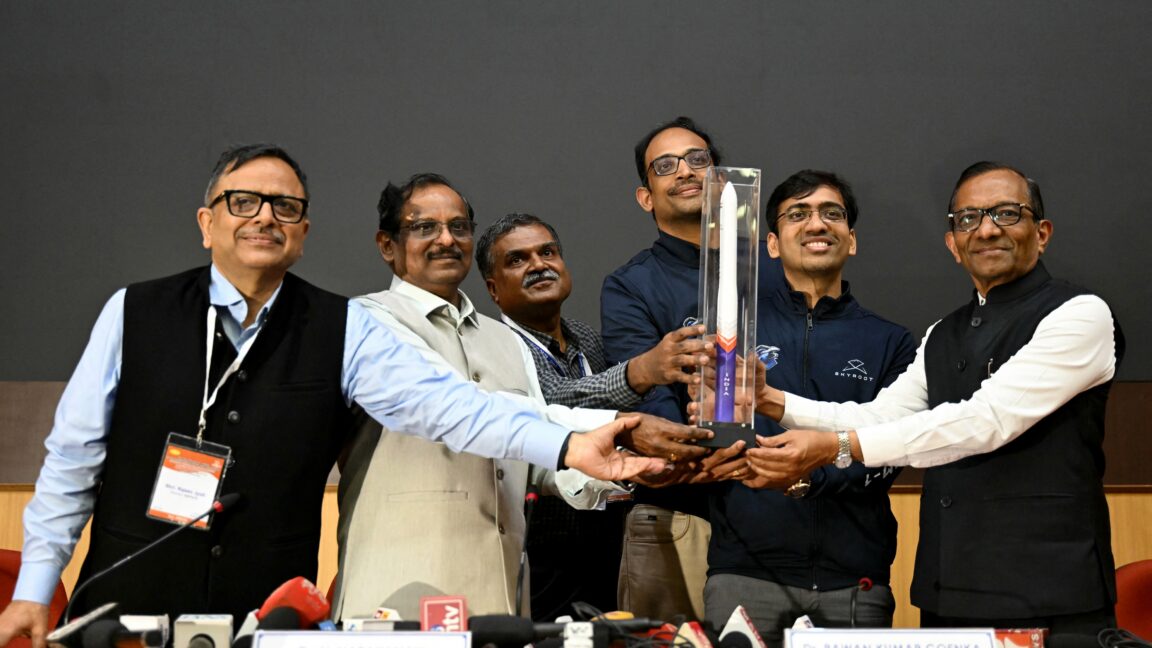
- 2018: Skyroot Aerospace is founded in Hyderabad by former ISRO scientists Pawan Kumar Chandana and Naga Bharath Daka, with the goal of democratizing space access through affordable, on-demand launches.
- November 2022: The company makes international headlines with the successful launch of Vikram-S, a suborbital technology demonstrator. This mission reached an altitude of 90 kilometers and validated many of the systems used in the orbital-class Vikram-1.
- 2023–2024: Skyroot secures significant venture capital, raising its total funding to approximately $160 million. This capital infusion allows for the expansion of its workforce to over 1,000 employees and the completion of its 3D-printing and carbon-composite manufacturing facilities.
- Saturday, 06:05 UTC: The original launch window opens, but a minor technical glitch in the ground support equipment triggers a brief hold.
- Saturday, 06:35 UTC: Ignition and liftoff. The Vikram-1 clears the launch tower, surpassing the mission’s "minimum success" criteria within seconds.
- Saturday, 06:45 UTC: Orbital insertion is confirmed. The upper stage deploys two CubeSats and maintains several other hosted payloads, officially making Skyroot the first private Indian company to reach orbit.
Defying the Odds of Aerospace Startups
The achievement is particularly notable given the historically high failure rate of debut orbital launches. In the aerospace industry, the first flight of a new rocket is often viewed as a high-risk "test," where the primary goal is simply to gather data.
To put Skyroot’s success into perspective, SpaceX—now the world leader in orbital launches—failed three times with its Falcon 1 rocket before reaching orbit on the fourth attempt in 2008. Similarly, Rocket Lab’s Electron, currently the most prolific small-satellite launcher, failed to reach orbit during its "It’s a Test" debut in 2017. While Blue Origin’s New Glenn succeeded on its first flight in 2025, that success came after decades of suborbital experience and massive capital investment.
"On the first attempt, reaching orbit, I never thought it was possible," said Pawan Kumar Chandana, CEO of Skyroot Aerospace, in an emotional address to his team following the launch. "Skyroot’s team made it possible. This launch was nothing short of a suspense movie, but the ending was perfect."
Government Support and the "NewSpace" Policy
The success of Vikram-1 is also a victory for the Indian government’s strategic pivot toward privatizing its space sector. In 2020, the administration of Prime Minister Narendra Modi established IN-SPACe (Indian National Space Promotion and Authorization Center), a dedicated agency designed to act as a bridge between ISRO and private startups.
Under this new framework, ISRO transitioned from being the sole operator of Indian space missions to a facilitator. For the Vikram-1 mission, ISRO provided Skyroot with access to its world-class testing facilities, solid motor casting plants, and the launch infrastructure at Sriharikota.
Pawan Goenka, Chairman of IN-SPACe, emphasized that the mission’s success validates India’s policy decisions. "The mission objective was only to lift off and clear the tower," Goenka stated. "That was only about 100 meters, but what we went to was 450 kilometers. The mission was absolutely perfect."
Prime Minister Modi also extended his congratulations, noting that the growing participation of the private sector is "opening new frontiers and accelerating innovation." This sentiment aligns with the government’s ambitious target of increasing India’s annual launch frequency from roughly five launches per year to 50 by the end of the decade.
Economic and Strategic Implications
The successful deployment of the Vikram-1 has significant implications for the global "NewSpace" economy. As the demand for satellite-based internet, Earth observation, and IoT (Internet of Things) services grows, the industry faces a bottleneck in launch availability. By providing a cost-effective, dedicated launcher for small satellites, Skyroot is positioning India to capture a larger share of the global space market, which is projected to reach $1 trillion by 2040.
Skyroot’s business model leverages India’s low labor costs and high engineering talent. With a valuation of $1.1 billion and a workforce whose average age is just 28, the company represents a new generation of agile aerospace firms. Their roadmap includes the Vikram-1U, which will feature strap-on boosters for heavier payloads, and the Vikram-2, which will introduce a cryogenic upper stage to double the rocket’s lift capacity to 2,000 pounds.
Furthermore, the Vikram-1’s use of solid fuel for its primary stages offers a strategic advantage: responsiveness. Solid-fueled rockets can be stored for long periods and launched on short notice compared to liquid-fueled rockets, which require complex fueling procedures. This makes the Vikram family attractive for "responsive space" missions, such as rapidly replacing damaged satellites or deploying urgent military reconnaissance assets.
Future Outlook: A Competitive Global Landscape
While Saturday’s success was historic, Skyroot faces stiff competition. In the United States, Rocket Lab continues to dominate the small-sat market, while Firefly Aerospace and Relativity Space are also vying for market share. In China, several private firms like Galactic Energy and CAS Space have already achieved orbital success.
However, Skyroot’s ability to reach orbit on its first try—combined with the backing of the Indian government and the cost advantages of the Indian manufacturing ecosystem—gives it a unique edge. The company plans to conduct at least one more launch before the end of the year to further validate the Vikram-1’s reliability.
In the long term, Chandana envisions Skyroot moving toward fully reusable, liquid-fueled rockets capable of a "daily cadence" of launches. "This is a 100 percent designed-in-India rocket, built by 100 percent Indian people, for India and for the world," Chandana said. "The world needs more access to space, and we are here to provide it."

As the Vikram-1’s upper stage continues to circle the Earth, it serves as a revolving testament to India’s evolving role in the cosmos. No longer just a follower in the space race, India, through its private pioneers, has firmly established itself as a leader in the next generation of orbital exploration.


