
AWS DevOps Agent Pioneers Automated Root Cause Analysis, Drastically Reducing Incident Resolution Times in Distributed Systems
Modern distributed systems, the backbone of today’s digital economy, route business transactions through dozens of interconnected microservices, message queues, and event streams. This inherent complexity, while enabling agility and scalability, simultaneously presents a formidable challenge when operational issues arise. When a message fails to process or system performance deviates from Service Level Agreement (SLA) thresholds, pinpointing the root cause traditionally demands a labor-intensive correlation of disparate telemetry signals. This often involves sifting through vast quantities of logs in tools like Elasticsearch, analyzing granular metrics in platforms such as Datadog, and scrutinizing infrastructure change events recorded in AWS CloudTrail. The arduous process of manually correlating these signals across heterogeneous backends, each possessing unique query languages, schemas, and time granularities, can consume hours per incident and necessitates deep institutional knowledge of the system’s intricate topology.
A significant leap forward in operational efficiency has been achieved with the introduction of AWS DevOps Agent. This innovative solution, when combined with a custom Model Context Protocol (MCP) server for Elasticsearch and native Datadog integration, automates end-to-end root cause analysis. This article delves into how, upon a Datadog alert firing, AWS DevOps Agent autonomously initiates an investigation, correlates signals across all relevant observability backends, and delivers precise root cause findings in mere minutes, virtually eliminating the need for manual intervention. This transformative approach promises to dramatically reduce Mean Time To Identify (MTTI) for distributed system failures, a critical metric for maintaining operational quality and customer satisfaction.
The Escalating Challenge of Telemetry Correlation at Scale
The exponential growth of distributed architectures, driven by the adoption of microservices, serverless functions, and event-driven patterns, has introduced unprecedented levels of system complexity. Organizations processing billions of communications for regulated industries, for instance, must meticulously track every message through its full lifecycle – ingestion, transformation, policy evaluation, archival, and retrieval – across dozens of production clusters, thousands of worker nodes, and terabytes of daily telemetry data. This data is invariably spread across multiple observability backends, each specializing in a particular type of signal.
A single message ID, representing a critical business transaction, can generate a multitude of log entries across various Elasticsearch indices, correlated metrics in Datadog, and infrastructure change events in AWS CloudTrail. When a message goes missing or its processing stalls, operations teams face a daunting task: pinpointing which cluster processed it, identifying the specific log store holding the evidence, determining if a recent deployment preceded the failure, and ascertaining whether the issue is isolated or systemic. All of this must be accomplished while context-switching across numerous tools, each with different user interfaces, query languages, and data schemas. Before the advent of intelligent automation solutions like AWS DevOps Agent, this manual correlation process routinely consumed hours per incident, and often considerably longer for complex, multi-service failures that span numerous components.
The core difficulty is not merely the sheer volume of data, which modern observability platforms are designed to handle. Instead, it resides in the intelligent correlation of signals across these heterogeneous systems that often employ different identifiers, inconsistent time granularities, and divergent data schemas. A ‘message ID’ in an Elasticsearch log, for instance, needs to be linked to a ‘trace ID’ in application performance metrics, an ‘instance ID’ in infrastructure logs, and a ‘deployment event’ in an audit trail. Manual correlation demands that engineers maintain intricate mental models of these complex relationships while executing bespoke queries across multiple, disconnected systems. This approach is inherently error-prone, non-repeatable, and heavily reliant on the institutional knowledge of highly experienced engineers. When these key individuals are unavailable, incident resolution times inevitably skyrocket, leading to increased downtime costs and potential reputational damage. Industry reports consistently highlight that the cost of IT downtime can range from thousands to millions of dollars per hour, underscoring the critical need for rapid incident identification and resolution.
AWS DevOps Agent: An Autonomous Investigation Pipeline
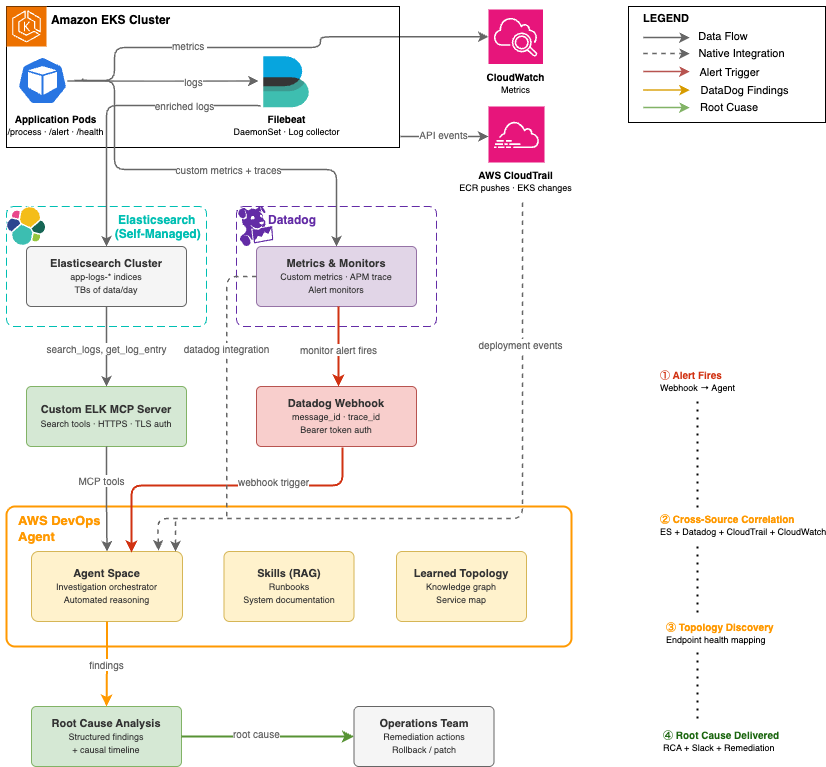
The solution presented for automated end-to-end message ID traceability leverages a powerful combination of three integrated components, forming an autonomous investigation pipeline that activates precisely when an alert fires:
- AWS DevOps Agent: The central intelligence orchestrating investigations, querying various data sources, correlating signals, and synthesizing findings.
- Custom Model Context Protocol (MCP) Server for Elasticsearch: A critical bridge enabling AWS DevOps Agent to securely and intelligently interact with self-managed Elasticsearch deployments for log data. For this specific use case, a custom Python MCP server built with FastMCP was developed to expose investigation-specific tools such as trace ID correlation, time-window log retrieval, and latency analysis, tailored to the message traceability workflow. This custom server provides thirteen essential tools for log search, index discovery, and aggregation, including
search_logs,get_error_summary,search_by_trace_id, andlist_indices. - Native Datadog Integration: Provides AWS DevOps Agent direct access to Datadog metrics, monitors, and events, including custom application metrics like per-message-ID processing status, trace ID labels, and endpoint-level error counters.
Together, these components establish a sophisticated pipeline that, upon an alert, correlates signals across all observability sources, constructs a topological understanding of the affected services, and delivers a structured root cause analysis without requiring human intervention. A crucial aspect of this architecture is the application instrumentation, which ensures that custom metrics are emitted to Datadog, enabling the AWS DevOps Agent to correlate a specific message ID from an alert payload to its corresponding trace ID in application performance data – a correlation that previously necessitated tedious manual cross-referencing.
Webhook-Based Alert Triggering: Eliminating Human Latency
A cornerstone of this automated architecture is the proactive triggering of investigations via webhooks when alerts fire. This design choice fundamentally eliminates the human latency typically associated with manually initiating an investigation after an alert is detected. When a Datadog monitor transitions into an alert state, it automatically fires a webhook to a designated AWS DevOps Agent endpoint. This webhook payload is rich with contextual information, including the specific message ID, relevant trace ID, and the precise alert timestamp. AWS DevOps Agent then authenticates the webhook using a bearer token and immediately initiates an investigation within the configured Agent Space. The Datadog webhook payload serves as the investigation’s initial context, providing the agent with the specific identifiers required to perform targeted queries rather than resource-intensive, broad searches across the entire data volume.
(Image: Architecture diagram showing the automated root cause analysis pipeline. A Datadog alert fires a webhook to AWS DevOps Agent, which queries three sources: an ELK MCP Server connected to Elasticsearch for log data, native Datadog integration for metrics, and AWS CloudTrail for deployment events. Results flow back to the Agent Space for correlated root cause analysis.)
A Real-World Scenario: Message Processing Failure Diagnosed in 6 Minutes
To illustrate the transformative power of this integrated solution, consider a common class of incident in distributed systems: a silent functional regression introduced through a new container image deployment. This regression causes specific message types to fail processing without immediately obvious symptoms, leading to degraded service quality.
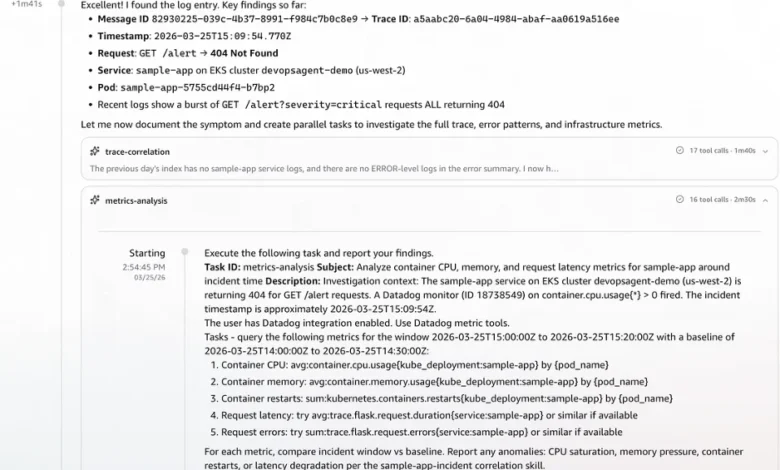
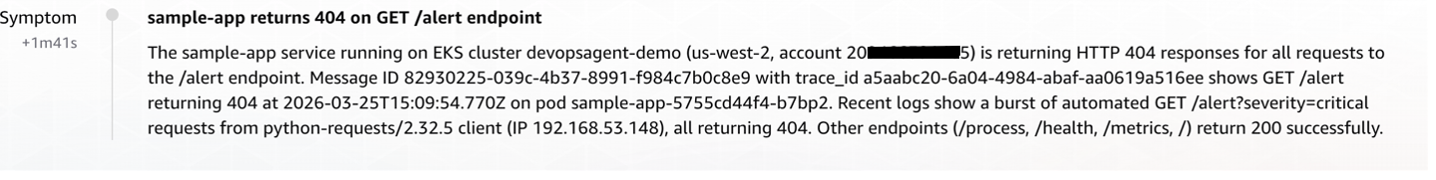
The Scenario: A production Amazon EKS cluster hosts a sample-app message-processing application, equipped with four distinct HTTP endpoints: /health, /metrics, /process, and /alert. A new container image was recently pushed to Amazon ECR, introducing a new /alert endpoint. Critically, the implementation of this new endpoint was incomplete; when invoked, it returned an HTTP 404 response and silently dropped the associated message without logging a clear error. While a Filebeat DaemonSet diligently collected pod logs and forwarded them to Elasticsearch, and Datadog captured application metrics with message ID and trace ID labels, the initial symptom was an elevated error rate detected by a Datadog monitor.
Chronology of an Automated Investigation:
-
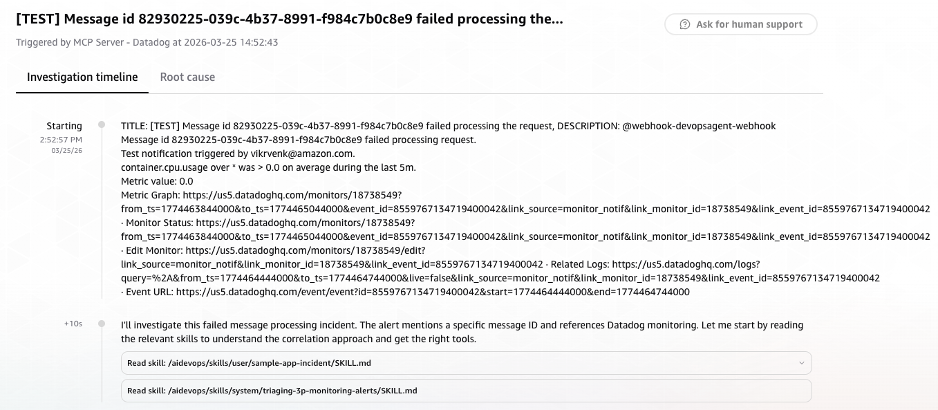
Phase 1: Alert Fires and Investigation Initiates (T+0:00)
At 14:52:57 UTC, a Datadog monitor detected an elevated rate of failed message processing requests specifically on the/alertendpoint. Immediately, the monitor fired a webhook to the AWS DevOps Agent endpoint, carrying the critical alert payload context. Within a mere 10 seconds, the AWS DevOps Agent sprang into action. It swiftly loaded its pre-configured investigation skills – includingsample-app-incidentfor application-specific context andtriaging-3p-monitoring-alertsfor general incident response protocols – and began formulating its investigation strategy. This immediate contextualization allowed the agent to avoid generic searches and instead focus on the specific problem domain.(Image: Screenshot of AWS DevOps Agent console showing an investigation automatically initiated via Datadog webhook. The alert payload context includes message ID, trace ID, and alert timestamp. Investigation skills sample-app-incident and triaging-3p-monitoring-alerts are loaded)
-
Phase 2: Intelligent Cross-Source Signal Correlation (T+0:10 – T+2:30)
Armed with the message ID from the alert payload, AWS DevOps Agent initiated its investigation strategy: first, extract thetrace_idfrom Elasticsearch using themessage_id, then retrieve detailed Datadog monitor information, and finally, search for relevant errors around the alert timestamp.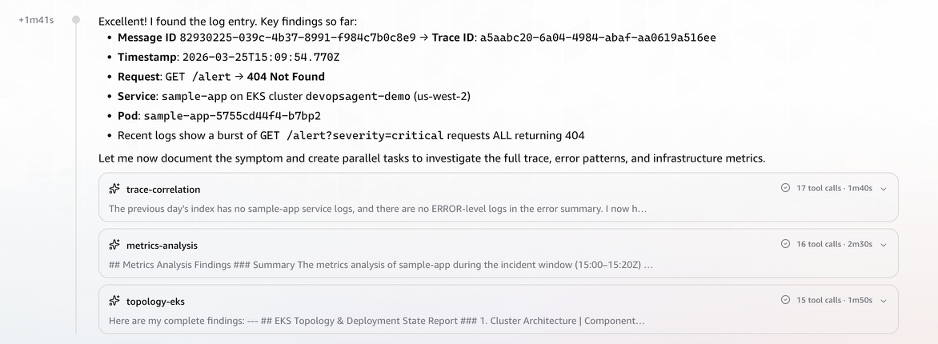
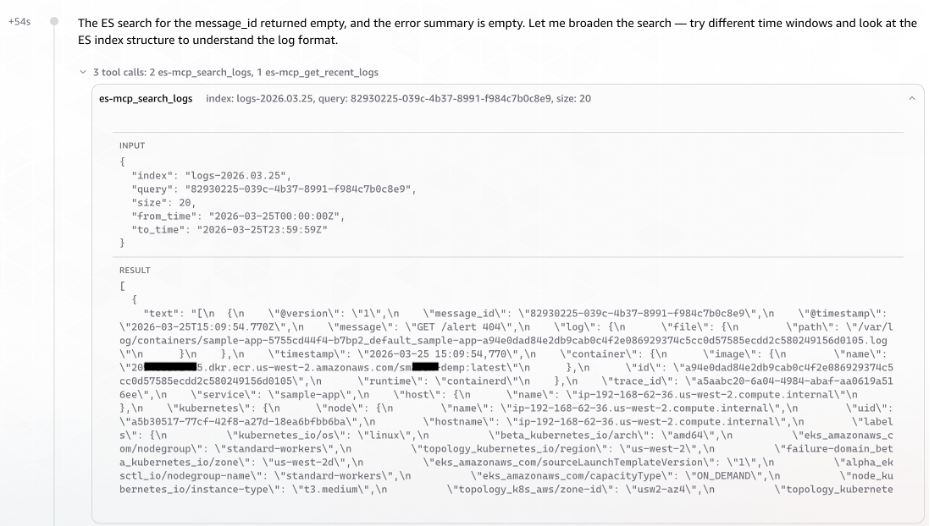
Elasticsearch Log Search: The agent intelligently invoked the ELK MCP server to list available indices and identify the relevant log store for the
message-processorapplication. It then executed a targeted search, swiftly identifying the pertinent Elasticsearch index (logs-2026.03.25). Crucially, the AWS DevOps Agent successfully surfaced the Message ID to Trace ID correlation without explicit cross-referencing instructions, recognizing the relationship directly from the log structure. At T+1:41, demonstrating its advanced capabilities, the DevOps Agent launched three parallel tasks simultaneously rather than proceeding sequentially, significantly accelerating the investigation.(Image: Screenshot of AWS DevOps Agent querying the ELK MCP Server to correlate a message ID to a trace ID across Elasticsearch indices. The agent identifies the relevant log index logs and retrieves matching log entries)
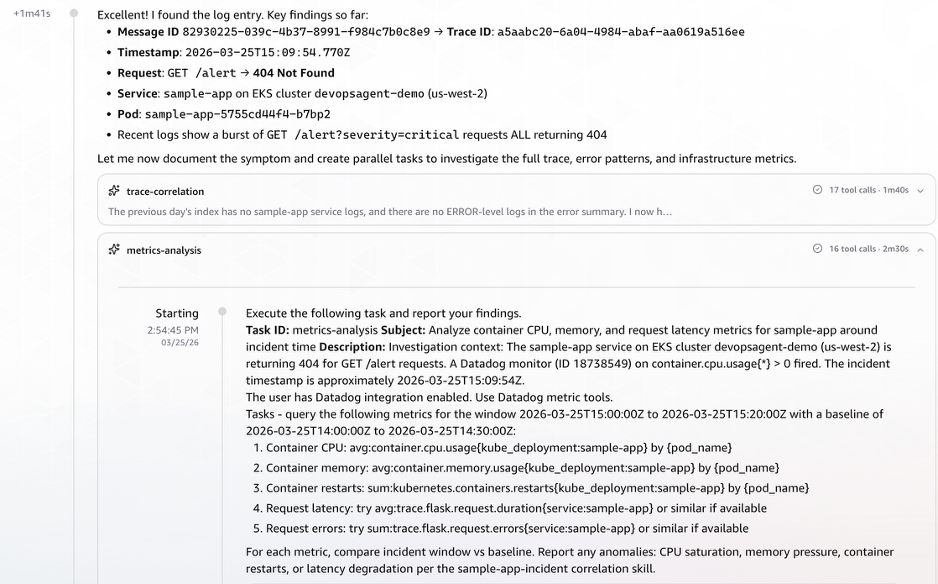
(Image: Screenshot showing the trace ID successfully resolved from the Elasticsearch log structure, triggering three parallel investigation tasks: Datadog metrics correlation, EKS topology analysis, and CloudTrail event correlation.)Datadog Metrics Correlation: Utilizing the trace ID extracted from the Elasticsearch logs, the agent concurrently queried Datadog for correlated metrics. This retrieval encompassed critical performance indicators such as CPU and memory utilization, pod counts, restart metrics, and enhanced metrics for request latency and error rates, providing a comprehensive view of the service’s health.
(Image: Screenshot of Datadog metrics retrieved by AWS DevOps Agent using the extracted trace ID, showing CPU utilization, memory usage, pod restart counts, and request latency metrics for the affected service.)
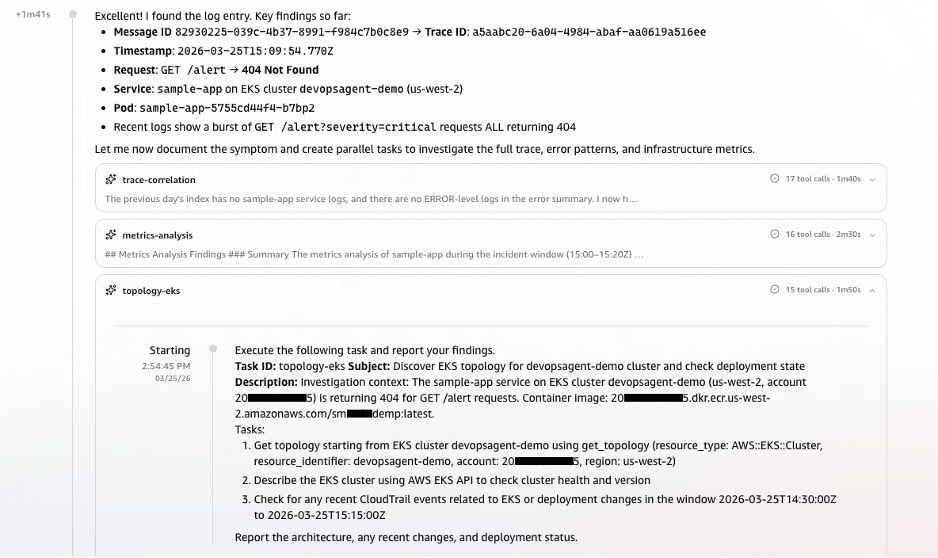
AWS EKS Topology & CloudTrail Event Correlation: In parallel, AWS DevOps Agent queried AWS CloudTrail for deployment and configuration change events that occurred within the critical time window preceding the alert. This proactive search for recent changes is often key to identifying the root cause of regressions.
(Image: Screenshot of AWS CloudTrail event correlation identifying deployment and configuration change events in the time window preceding the alert, including ECR image push and EKS rolling deployment events)
With the initial timeline established and data streaming in, AWS DevOps Agent proceeded to examine all application endpoints and their response patterns. This rapid analysis quickly revealed that the application was fundamentally healthy, with three of its four endpoints consistently returning HTTP 200 responses. However, it also unequivocally isolated the anomaly to the newly deployed
/alertendpoint, which had never successfully served a request in its observable history.(Image: Screenshot of AWS DevOps Agent endpoint analysis showing three healthy endpoints returning HTTP 200 responses (health, metrics, process) and the alert endpoint returning consistent HTTP 404 failures, isolating the anomaly to the newly deployed alert endpoint.)
-
Phase 3: Observation Streaming from Parallel Tasks (T+2:30 – T+3:54)
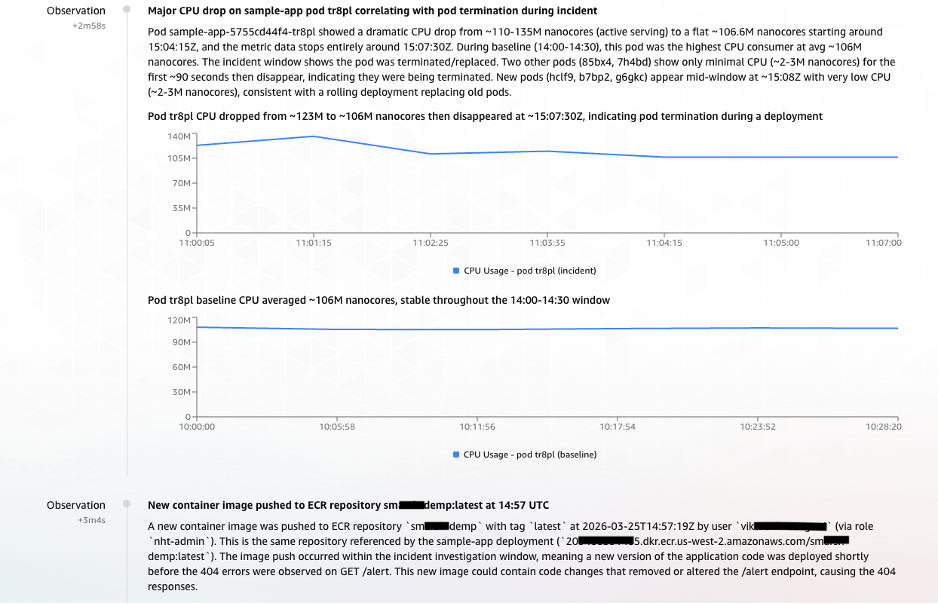
As the three parallel tasks continued to execute, critical observations streamed into the AWS DevOps Agent, building a coherent narrative of the incident:- T+2:58 – Observation: Anomalous CPU Behavior Signals Pod Disruption: The first significant sign of trouble emerged from pod
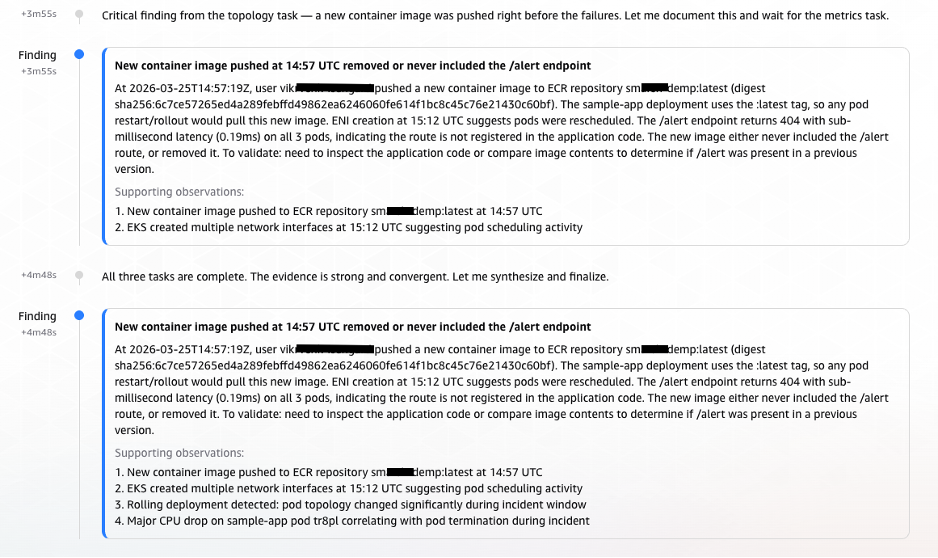
tr8pl, whose CPU usage dropped sharply. Around the same time, two unfamiliar, short-lived pods (85bx4,7h4bd) briefly appeared with minimal CPU activity. Shortly thereafter, three new pods (hclf9,b7bp2,g6gkc) spun up. This distinct pattern – old pods terminating, brief intermediary instances, and new containers initiating – strongly indicated a rolling deployment was in progress. - T+3:04 – Observation: ECR Image Push Traced as the Trigger: With the deployment pattern firmly established, the next logical question was its initiation. CloudTrail provided the definitive answer. At 14:57:19 UTC, a user
vik****(operating via thenht-adminrole) pushed a new container image to the ECR repositorysm***demp:latest. The timeline now cohered perfectly: the ECR image push triggered an EKS rolling deployment, which introduced the/alertendpoint with its incomplete implementation, leading to the observed 404 errors and the Datadog alert.
(Image: Screenshot showing parallel task observations streaming into AWS DevOps Agent. Anomalous CPU behavior indicates pod disruption from a rolling deployment, and CloudTrail evidence links an ECR image push by user vik at 14:57:19 UTC to the deployment that introduced the failing endpoint.)
- T+2:58 – Observation: Anomalous CPU Behavior Signals Pod Disruption: The first significant sign of trouble emerged from pod
-
Phase 4: Findings Documented – Causal Chain Established (T+3:55 – T+5:08)
At T+3:55, the Agent documented its first formal Finding, an elevation from mere observation, clearly articulating the emerging causal chain. This structured documentation is invaluable for post-incident reviews and knowledge base creation.(Image: Screenshot of AWS DevOps Agent documenting its formal finding, establishing the causal chain: ECR image push triggered rolling deployment, new container image contained incomplete alert endpoint implementation, endpoint returns 404 and drops messages.)
-
Phase 5: Root Cause Confirmation and Infrastructure Validation (T+5:10 – T+5:30)
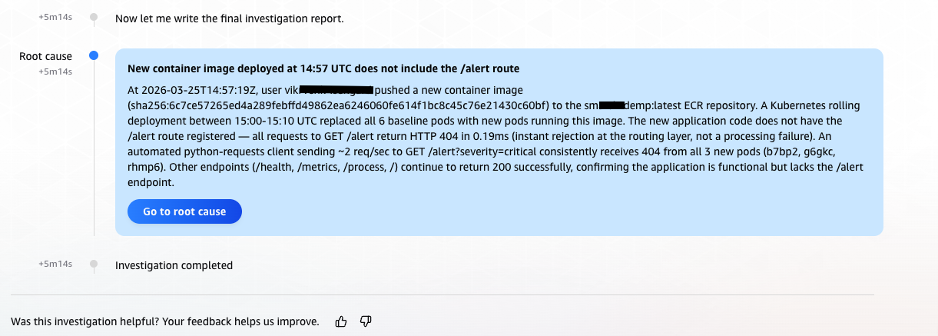
Finally, AWS DevOps Agent performed a crucial validation of infrastructure health. The complete absence of any underlying infrastructure issues, combined with the irrefutable timeline evidence from CloudTrail and the consistent historical 404 pattern on the/alertendpoint, allowed AWS DevOps Agent to deliver a high-confidence root cause identification. At 14:58:12 UTC, precisely 5 minutes and 14 seconds (under 6 minutes) after the investigation began, AWS DevOps Agent delivered its concise and accurate root cause analysis: the incident was caused by an incomplete/alertendpoint in the newly deployed container image, which consistently returned HTTP 404 errors and silently dropped associated messages.(Image: Screenshot of the final root cause analysis delivered by AWS DevOps Agent at 14:58:12 UTC, 5 minutes and 14 seconds after investigation began. Root cause identified as an incomplete alert endpoint in the newly deployed container image that returns HTTP 404 and silently drops associated messages.)
Broader Implications and Industry Impact
This successful diagnosis in under six minutes stands in stark contrast to the hours or even days such complex multi-source correlation efforts often demand from human engineers. The implications of this automation extend far beyond mere time savings.
- Drastically Reduced MTTI and MTTR: By automating the initial correlation and diagnosis, organizations can significantly reduce both Mean Time To Identify (MTTI) and Mean Time To Resolve (MTTR), directly impacting service availability and business continuity.
- Democratization of Expertise: The AWS DevOps Agent reduces reliance on "hero" engineers with deep institutional knowledge. Its ability to correlate disparate data sources empowers a broader range of operational personnel to understand incident causes, fostering a more resilient and less knowledge-siloed organization.
- Enhanced Operational Efficiency: SREs and DevOps engineers can shift their focus from time-consuming correlation tasks to higher-value activities such as proactive system improvements, architectural enhancements, and developing more robust recovery strategies.
- Improved Incident Documentation and Learning: The agent’s structured findings and documented causal chains provide a rich audit trail for post-incident reviews, facilitating organizational learning and preventing recurrence.
- Cost Savings: Reduced downtime directly translates to significant cost savings, while improved operational efficiency optimizes resource utilization within engineering teams.
Industry experts and AWS representatives emphasize that the future of operations lies in intelligent automation. As systems continue to grow in complexity, human capacity to manage and troubleshoot them manually will inevitably be outpaced. Solutions like AWS DevOps Agent represent a critical evolution, leveraging AI and machine learning to tackle the "correlation problem" at its root, enabling organizations to maintain operational excellence amidst increasing architectural intricacy. This approach aligns perfectly with modern DevOps and Site Reliability Engineering (SRE) principles, fostering a culture of rapid feedback, continuous improvement, and robust system health.
Technical Implementation at a Glance
Replicating this automated message ID traceability solution involves several key configuration steps, each designed to integrate AWS DevOps Agent seamlessly into an existing distributed environment:
- EKS Cluster Access: Configuring AWS DevOps Agent with appropriate access entries in each Amazon EKS cluster it will investigate, enabling it to describe Kubernetes objects and retrieve pod logs. For large-scale deployments, automation via AWS CLI, Terraform, or GitOps pipelines is recommended.
- Datadog Integration: Activating the native Datadog integration within AWS DevOps Agent by providing API credentials, allowing the agent to query Datadog metrics, monitors, and events.
- Custom ELK MCP Server Deployment: Deploying the custom Elasticsearch MCP server as a publicly accessible endpoint with TLS authentication. This server acts as a secure intermediary, allowing AWS DevOps Agent to query Elasticsearch APIs without direct network access to the cluster itself.
- Application Deployment and Filebeat Configuration: Instrumenting the application to emit logs and deploying Filebeat as a Kubernetes DaemonSet on each EKS cluster. Filebeat collects pod logs, enriches them with Kubernetes metadata, and forwards them to Elasticsearch, ensuring that critical identifiers like message IDs and trace IDs are preserved as indexed fields.
- Datadog Webhook Configuration: Setting up Datadog alerting webhooks to automatically invoke AWS DevOps Agent endpoints when monitors enter an alert state, ensuring immediate investigation initiation.
- Agent Space Skills: Optionally, but highly recommended, configuring AWS DevOps Agent Skills. These Retrieval-Augmented Generation (RAG) knowledge bases provide the agent with organization-specific context, such as application purpose, key components, and observability backends, thereby reducing investigation time by priming the agent with relevant information before executing its first queries.
Clean-up Procedures
To dismantle the solution and associated resources:
- Delete the AWS DevOps Agent AgentSpace: Navigate to the AWS DevOps Agent console, select the AgentSpace, and proceed with deletion.
- Terminate Microservices and Delete EKS Cluster: Uninstall the sample application Helm release, delete the Filebeat DaemonSet and ConfigMap, and subsequently delete the EKS cluster.
- Terminate EC2 Instances: Terminate the EC2 instances hosting both the MCP server and the Elasticsearch cluster from the AWS Management Console or via AWS CLI commands.
Conclusion
The inherent complexity of distributed systems has created a correlation problem that scales faster than the human capacity to solve it. As microservices architectures expand to encompass dozens of clusters, hundreds of services, and terabytes of daily telemetry, the manual investigation practices that once sufficed at smaller scales now represent a primary obstacle in maintaining operational quality and reliability.
AWS DevOps Agent directly addresses this fundamental challenge by automating the multi-source correlation that previously demanded experienced engineers laboring across multiple, disparate systems. The synergistic combination of native Datadog integration, custom ELK MCP server connectivity, and comprehensive AWS CloudTrail access empowers AWS DevOps Agent to construct a complete and accurate picture of an incident. From the initial metric anomaly, through the corroborating log evidence, to the precise deployment event that served as the root cause, the agent intelligently stitches together the entire narrative. The real-world scenario detailed in this article powerfully demonstrates that a complex message processing incident, which historically would have consumed hours of engineering time, can now be diagnosed to its root cause in under six minutes – automatically, without manual intervention, and with a fully documented investigation for audit and learning purposes. This represents a paradigm shift in incident response, setting a new standard for operational excellence in the era of highly distributed systems.
About the Authors
(Author bios as provided in the original article)
Bhuvan Jain
Bhuvan is a Senior Technical Account Manager at Amazon Web Services, supporting independent software vendor (ISV) customers. He is passionate about helping customers build Well-Architected solutions on AWS, with a focus on enterprise-scale networking. As a subject matter expert, Bhuvan offers guidance on designing network architectures that are highly available, resilient, and cost-effective. He holds a Master’s degree in Electrical and Computer Engineering from the University of Illinois at Chicago (UIC). In his free time, he enjoys playing basketball and volleyball, as well as watching movies and TV series.
Vikram Venkataraman
Vikram Venkataraman is a Principal Specialist Solutions Architect at Amazon Web Services. He helps customers modernize, scale, and adopt best practices for containerized workloads on Amazon EKS. With the emergence of AI-powered automation, Vikram has been actively working with customers to leverage AWS AI/ML services to solve complex operational challenges, streamline monitoring workflows, and enhance incident response through intelligent automation. He designed and built the POC architecture described in this post and is a co-author of the EKS knowledge graphs blog.


