Uncovering the hidden performance impact of Microsoft Defender on developer tool startup times

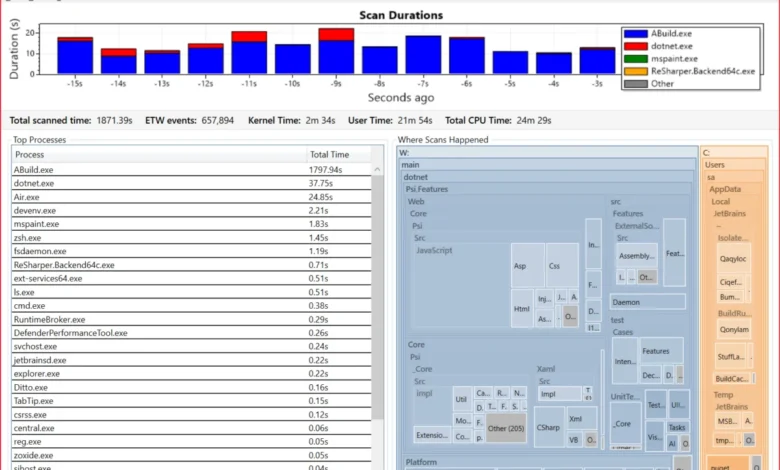
The quest for IDE responsiveness has long been the primary focus for software engineering teams at JetBrains, particularly as their flagship products—ReSharper and Rider—have grown in complexity. Recent investigations into startup latency revealed that the bottleneck was not rooted in code bloat or memory management, but rather in the interaction between modern out-of-process (OOP) architectures and Microsoft Defender’s real-time security scanning. This discovery, which involved rigorous profiling and direct collaboration with Microsoft, has shed light on how Windows security protocols can inadvertently penalize legitimate development environments, leading to significant performance degradation during the initial launch phase.

The Evolution of IDE Architecture and the Performance Paradox
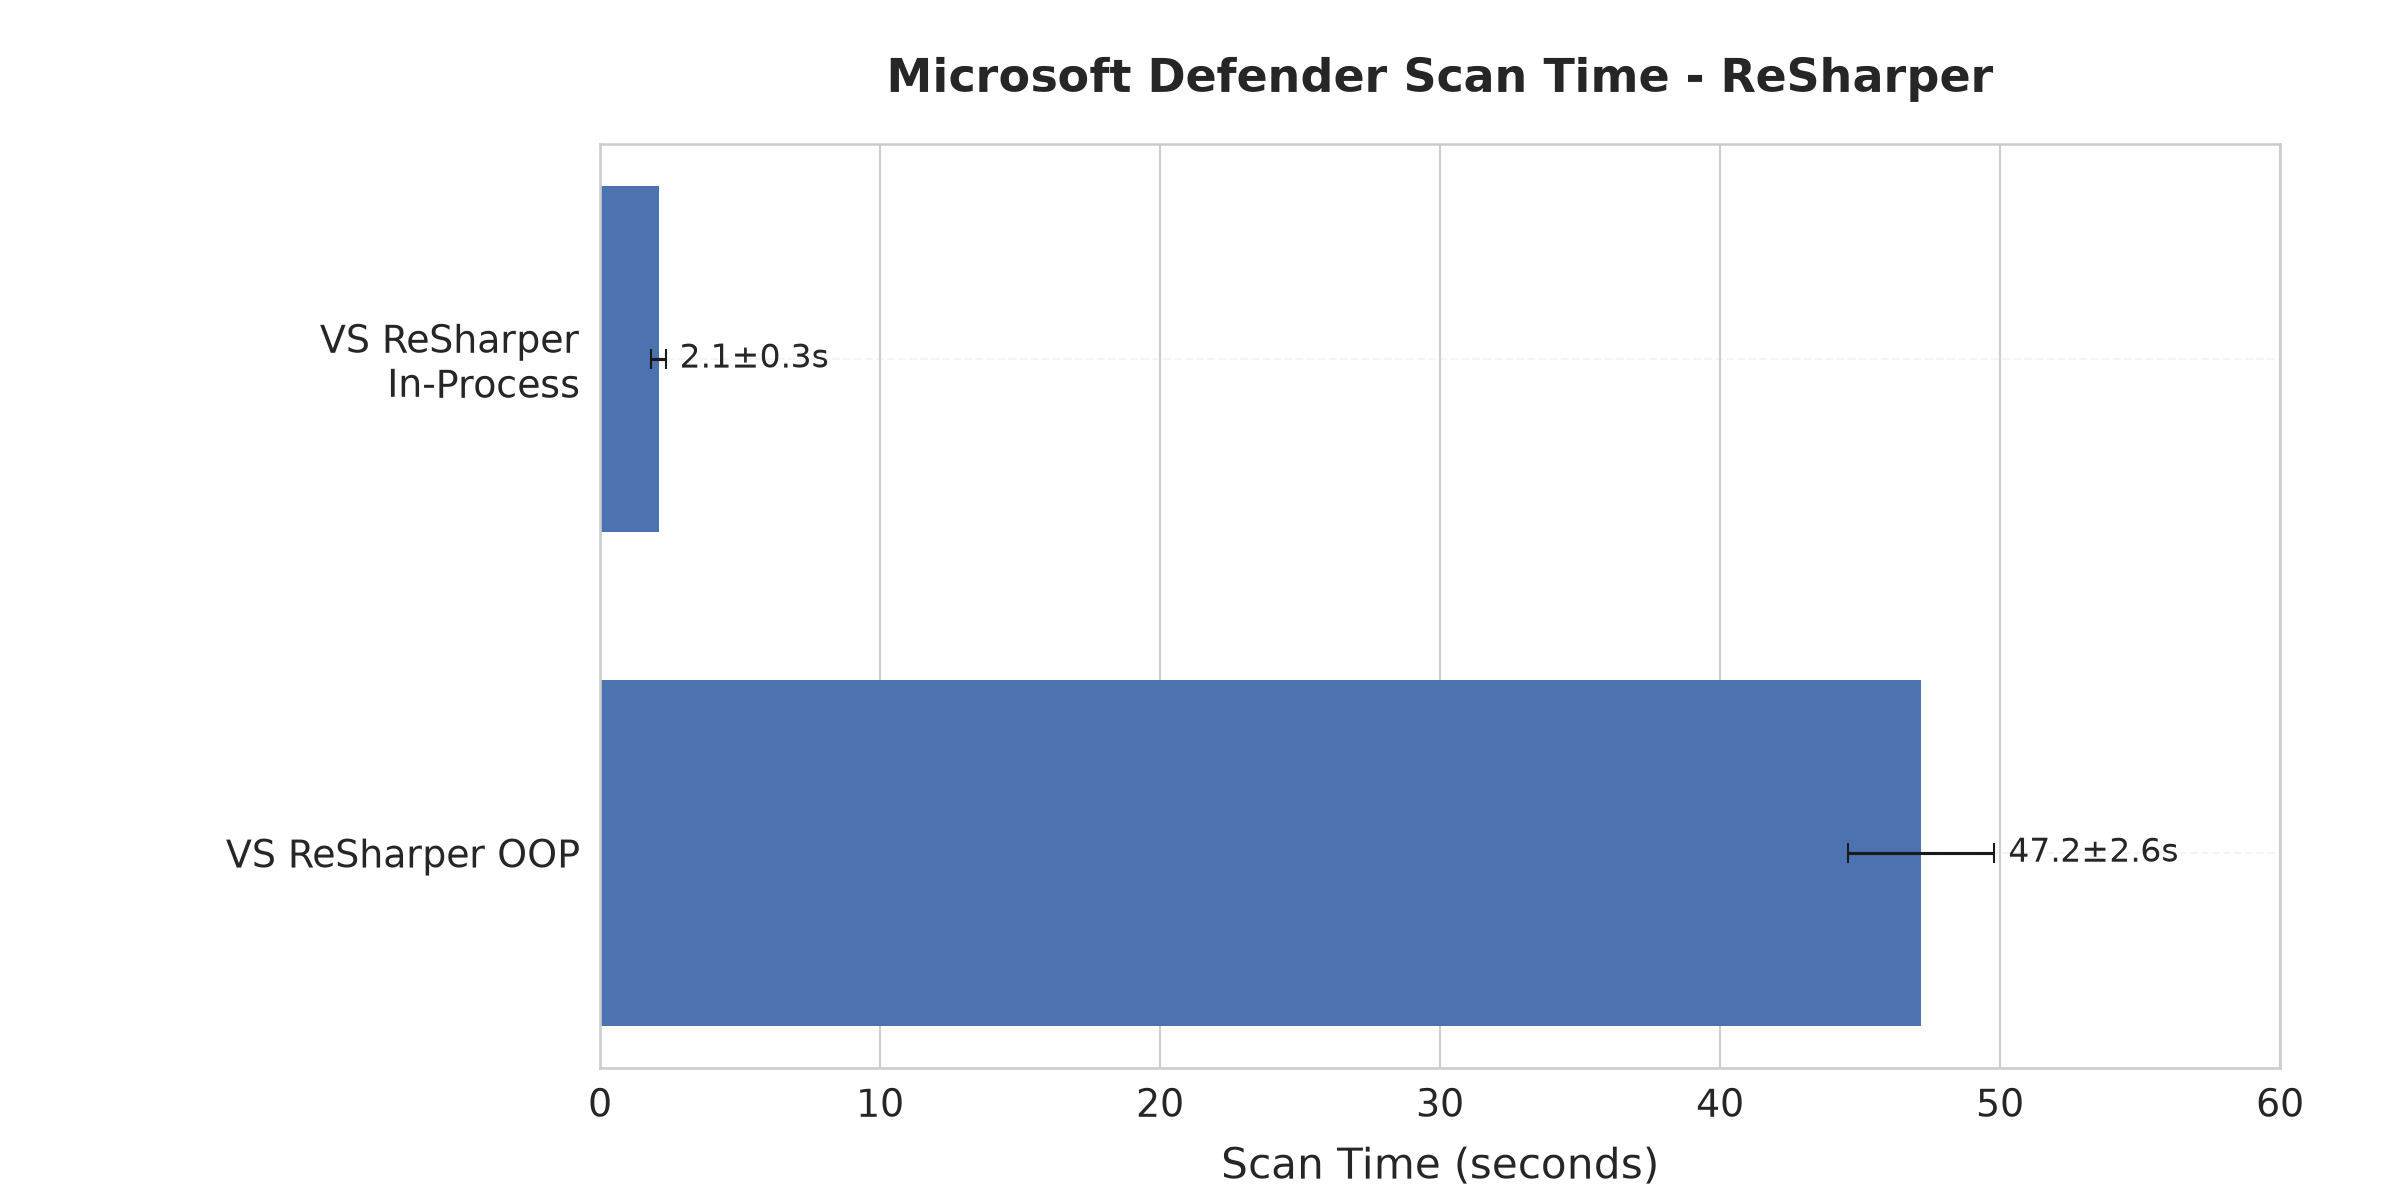
For years, ReSharper operated as an in-process extension within Visual Studio. While this allowed for deep integration, it also tethered the IDE’s stability to the plugin’s memory footprint, often resulting in UI freezes. To combat this, JetBrains introduced an out-of-process (OOP) architecture, moving heavy analytical workloads into separate background processes. While this shift successfully stabilized the Visual Studio UI, it inadvertently introduced a new performance hurdle: slower startup times.
Initially, the engineering team suspected the overhead of inter-process communication or process initialization. However, after extensive profiling and telemetry analysis, they identified that Microsoft Defender was performing significantly more aggressive scans on these new, separate processes compared to the monolithic in-process predecessors.

Chronology of the Investigation
The investigation began in late 2025 following a surge in user feedback regarding sluggish IDE launches after the adoption of the OOP architecture. By early 2026, JetBrains had established a repeatable testing environment, utilizing a controlled Windows 11 Pro virtual machine (VM) configured with 8 vCPUs and 8 GB of static RAM.
- August 2025: ReSharper’s new OOP architecture is launched to the public. Initial telemetry shows improved UI responsiveness but hints at a regression in cold-start times.
- Late 2025: Internal profiling isolates Microsoft Defender as the primary source of latency. Data indicates that while in-process plugins were scanned in approximately two seconds, the new OOP components were subject to scans lasting nearly 50 seconds.
- Early 2026: JetBrains develops an internal benchmarking suite to analyze Event Tracing for Windows (ETW) logs, confirming that Defender’s
StreamScanRequestTaskwas consistently firing on startup for these specific processes. - Mid-2026: Engagement with Microsoft leads to an understanding of "write-protected" directory trust rules. Microsoft implements optimizations in Defender version 1.449.454.0 to address specific patterns observed in JetBrains tools.
- September 2026: ReSharper 2026.2.1 is released, featuring the optimized OOP architecture enabled by default.
Quantitative Analysis of Scan Latency
The discrepancy in scanning duration is tied to the file system path and the trust level afforded to specific directories. Processes running from write-protected, system-level paths are often subjected to a "lighter" scan compared to those running from user-writable directories.

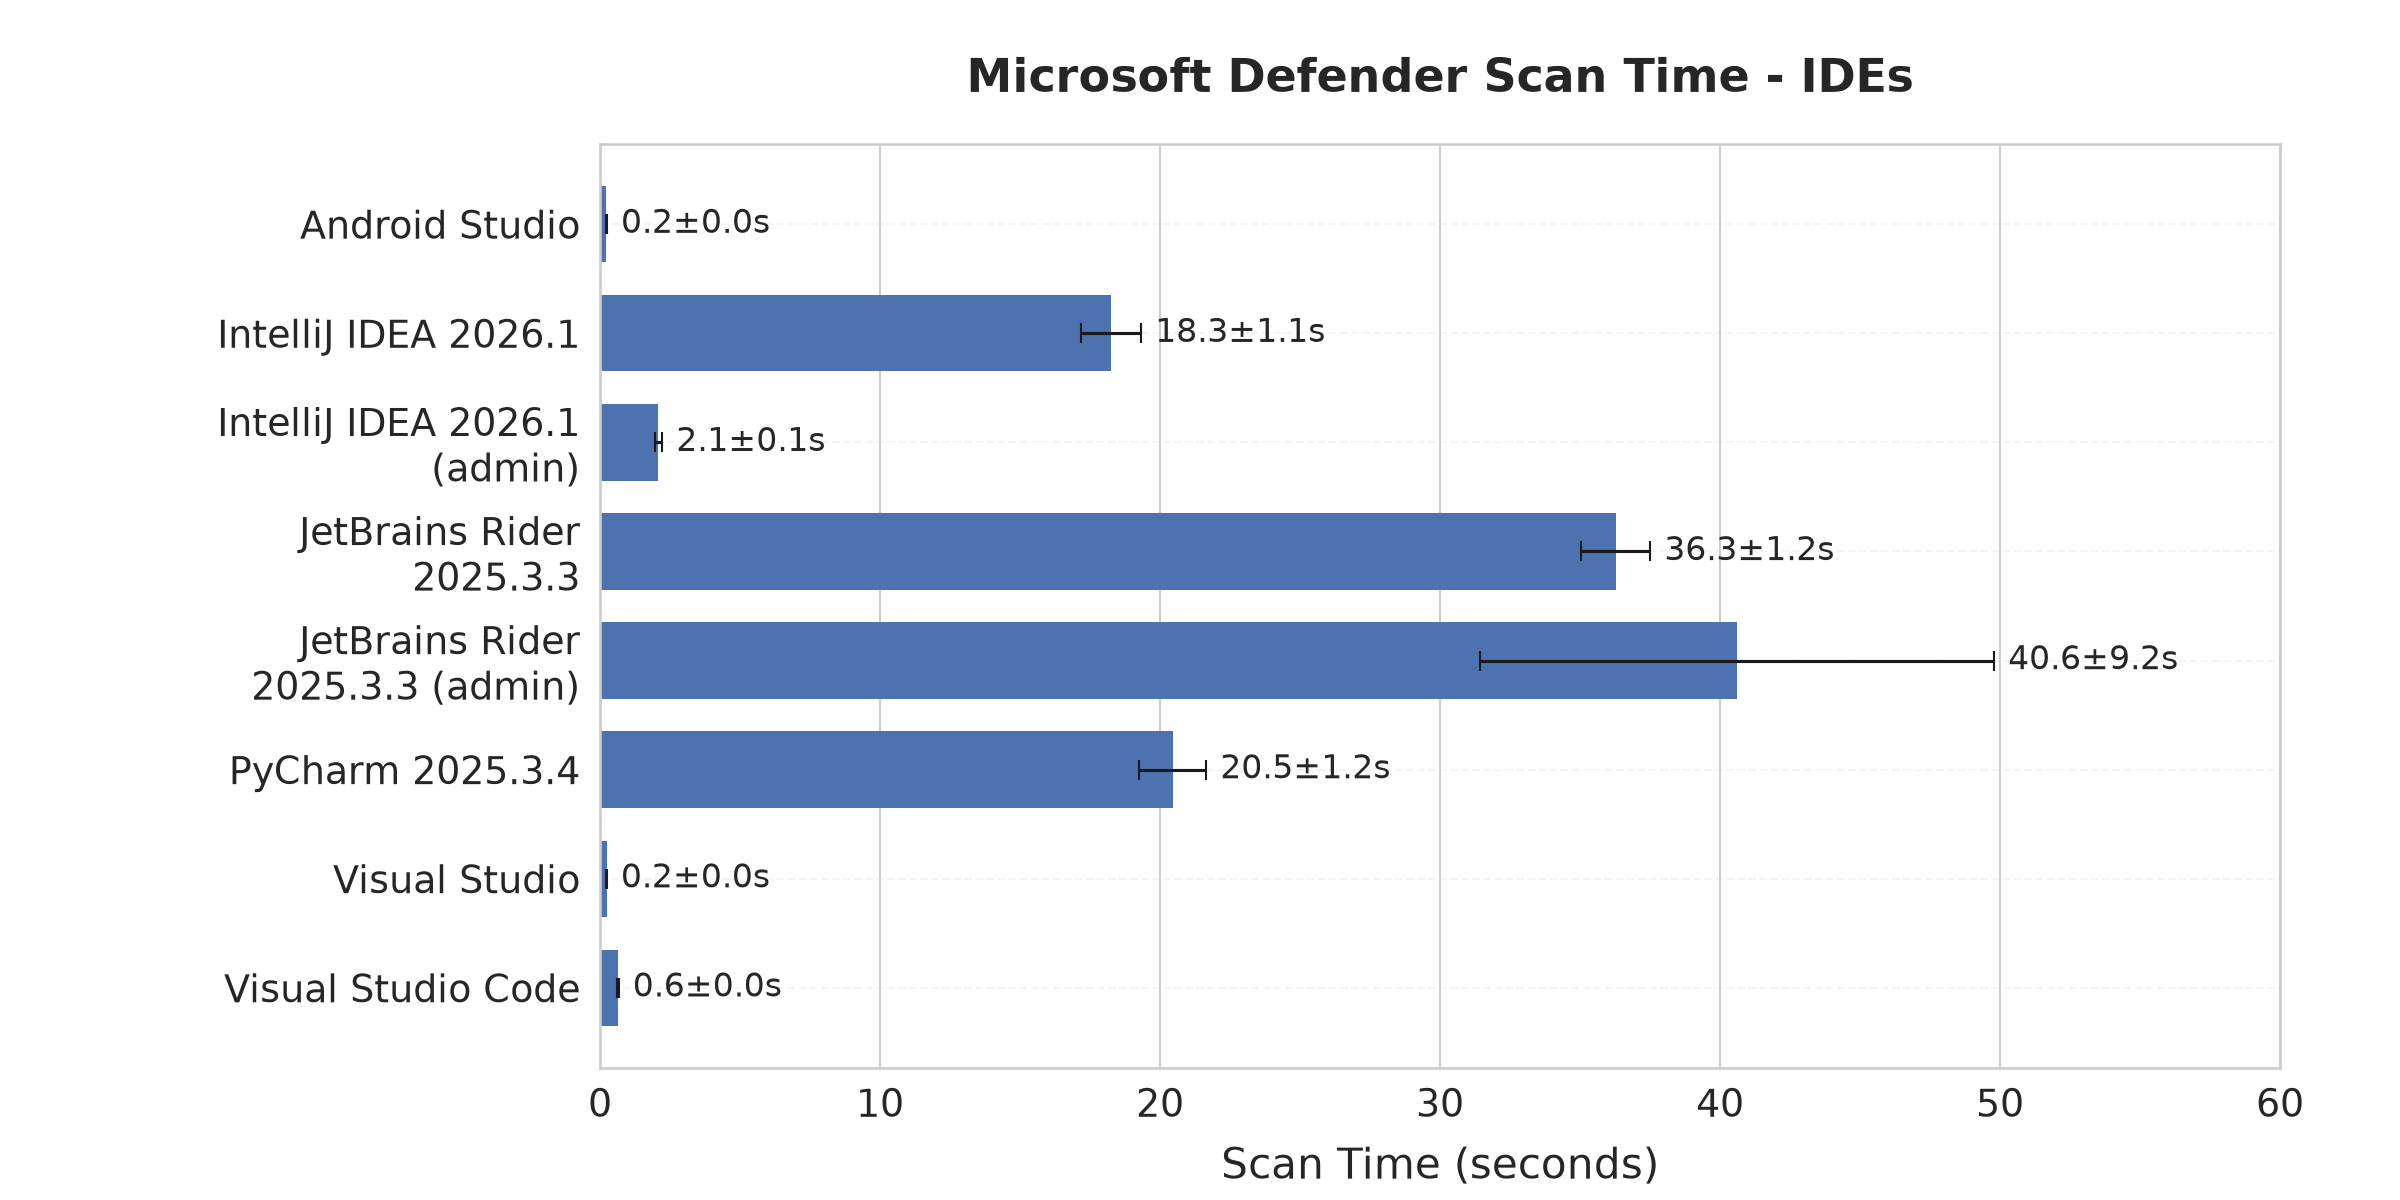
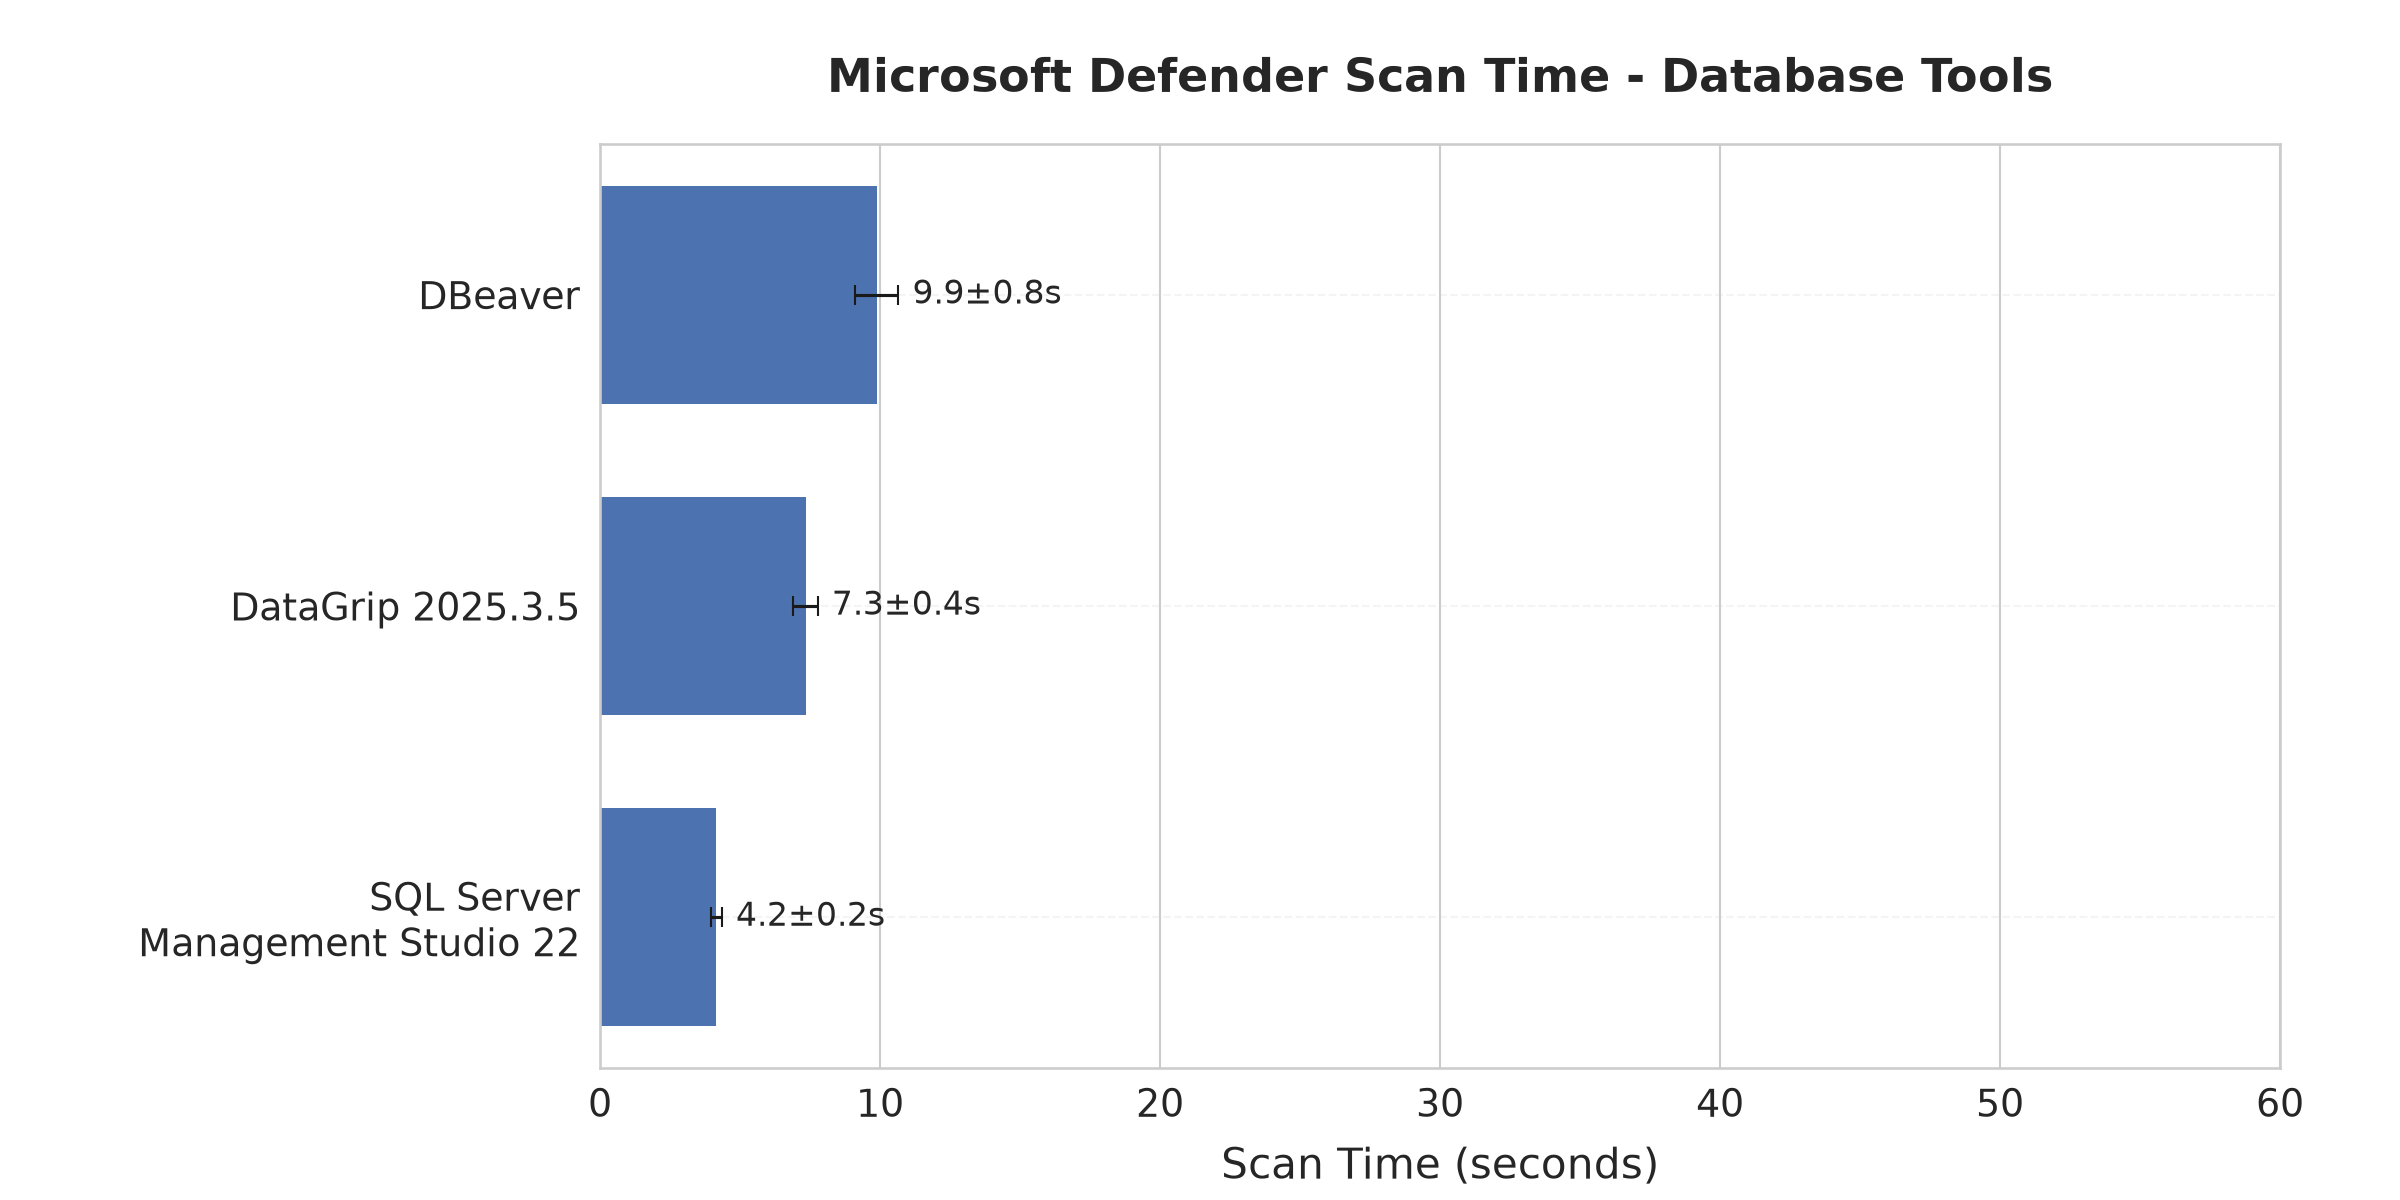
The performance data collected by the JetBrains team highlighted a striking divide. Standard IDEs like IntelliJ IDEA (when run as an administrator) or Visual Studio exhibit minimal scan times of under two seconds. In contrast, applications installed via user-level managers—such as the JetBrains Toolbox, which typically installs software in the %LOCALAPPDATA%Programs directory—do not benefit from the same "trusted" status, resulting in scan times that frequently exceed 20 to 40 seconds.
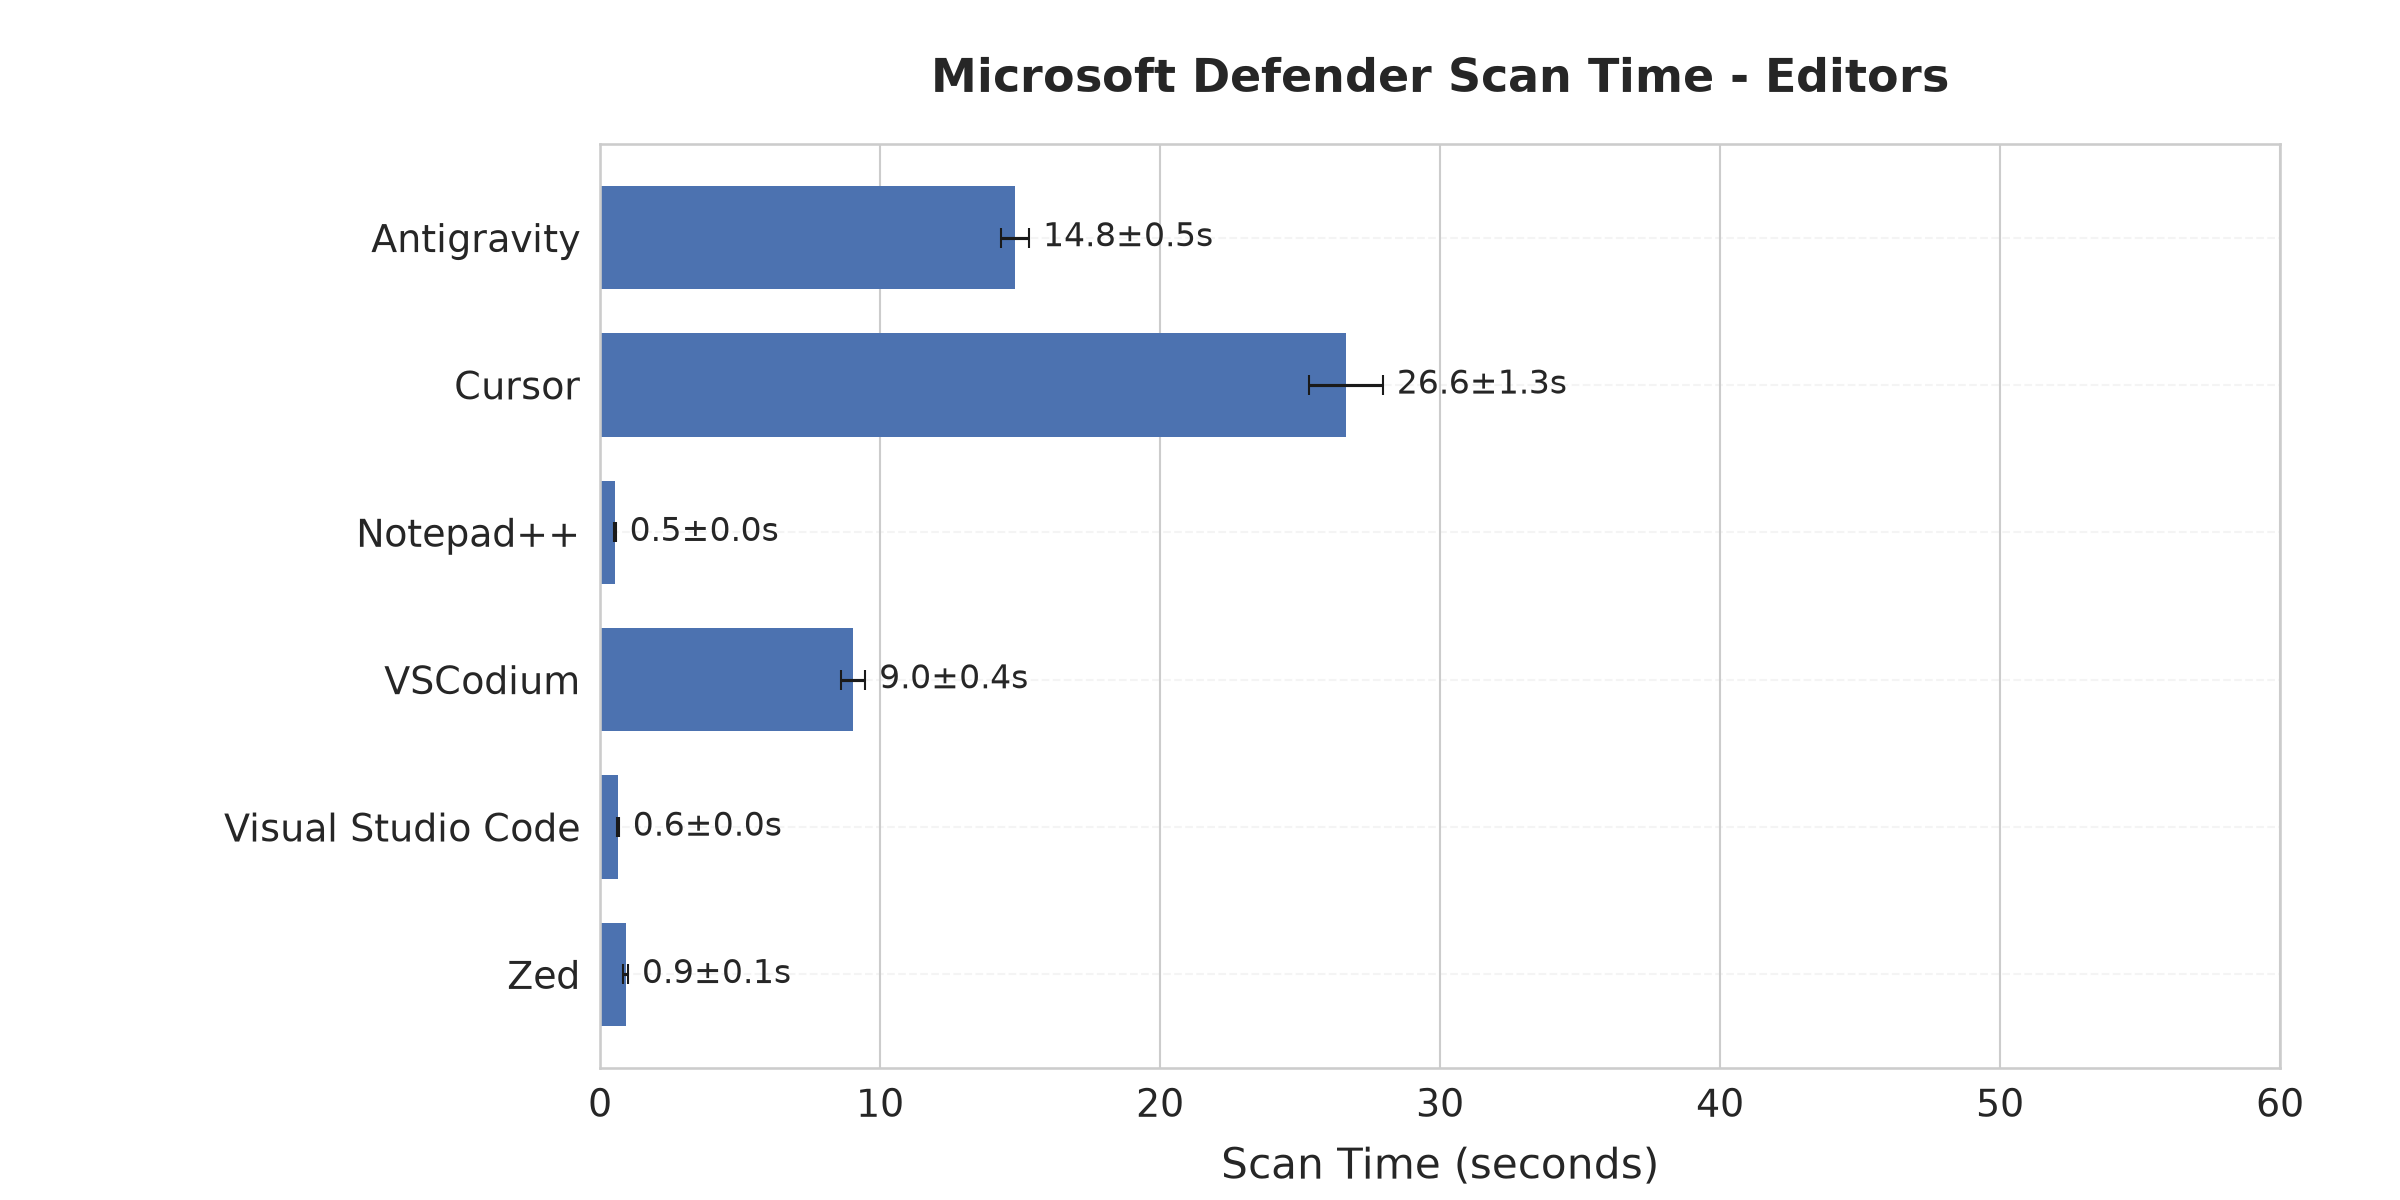
This issue extends beyond the JetBrains ecosystem. Other developer-centric tools, including various CLI-based AI agents, were observed to have near-instant scan times, while editors like Cursor or VSCodium showed significantly higher scan overheads. This suggests that the security engine’s heuristics are highly sensitive to installation location and the specific behavioral patterns of the executable during the first few seconds of runtime.
Collaboration and Institutional Response
The resolution of this issue highlights the necessity of transparency between independent software vendors and operating system providers. JetBrains’ decision to contact Microsoft directly was pivotal. By sharing their findings regarding ETW logs and specific scan task triggers, they enabled Microsoft’s security engineers to better understand how their antimalware heuristics were impacting legitimate, high-frequency developer workflows.
Microsoft’s intervention resulted in a targeted update to the Defender engine, which improved the scan performance for JetBrains tools when installed in specific directories. This collaboration emphasizes a broader trend: as developer tools become more modular, the "hidden" cost of security software must be managed through better communication between OS developers and application vendors.
Broader Implications for Software Development
The findings suggest that the "startup tax" paid by developers is often a byproduct of security measures designed for general-purpose applications rather than specialized software development environments. For the average user, these scans are a necessary defense; for the developer, they represent a significant loss of productivity.
The implications for the industry are twofold:
- Transparency in Security: There is a clear need for security vendors to provide more insight into why certain applications are flagged for deep inspection. The reliance on "black box" heuristics can lead to unpredictable performance regressions.
- Standardization of Exclusions: While tools like JetBrains Rider have long encouraged the use of manual exclusions via the
Add-MpPreferencePowerShell cmdlet, this is a manual, user-intensive process that can be blocked by enterprise IT policies. The industry may need a more standardized, secure way to communicate the "trustworthiness" of verified developer tools to OS-level security engines.
Tools for the Community
To empower other developers and vendors facing similar hurdles, JetBrains has released their internal "Defender Performance Tool" as an open-source project. This utility allows users to:
- Collect and visualize Microsoft Defender performance recordings.
- Identify specific files or processes triggering long scan times.
- Compare performance metrics across different software configurations.
Best Practices for Mitigation
For developers and organizations looking to optimize their own development environments, the current best practices remain centered on careful configuration of security policies. First, ensure that build directories and IDE installation paths are exempted from real-time scanning if corporate security policy allows. Second, consider the installation directory; installing tools in system-protected folders can sometimes trigger more favorable scan heuristics, though this should be balanced against the need for easy updates. Finally, leveraging diagnostic tools like the newly released Defender Performance Tool is essential for distinguishing between genuine application bloat and external interference from security software.
As software development continues to move toward more modular, distributed, and AI-assisted workflows, the interaction between these tools and the underlying operating system will only grow in complexity. The resolution of the ReSharper startup delay serves as a case study in the importance of performance profiling that extends beyond the application’s own codebase and into the surrounding environment. By identifying the root cause—the interplay between security scanning and process location—JetBrains has not only improved their own product but has provided a roadmap for the wider developer community to reclaim lost productivity.