AWS DevOps Agent Expands Autonomous Incident Investigation Capabilities by Integrating Custom Data Sources Through Model Context Protocol
AWS DevOps Agent is transforming production incident response by autonomously investigating a growing range of failures. It adeptly diagnoses complex issues like CrashLoopBackOff failures in Kubernetes, meticulously traces ConfigMap deletions through audit logs, and correlates Amazon CloudWatch metrics with granular cluster events – all without requiring direct human intervention. This significant leap towards autonomous operations streamlines incident resolution and reduces the cognitive load on engineering teams, allowing them to focus on innovation rather than reactive troubleshooting. The agent’s ability to process vast amounts of operational data, identify anomalies, and pinpoint potential causes represents a crucial advancement in the field of AIOps, pushing the boundaries of what automated systems can achieve in complex cloud environments.
However, the AWS DevOps Agent, like any sophisticated analytical tool, operates within a defined visibility boundary. Its autonomous investigation capabilities are primarily limited to the data accessible via its native integrations. When the critical diagnostic information required for root cause analysis resides outside these established channels—perhaps deep within a node’s operating system, encapsulated within a third-party monitoring solution, or behind the intricate internal diagnostics of a database system—the agent encounters a significant impediment. In such scenarios, it can effectively describe the symptoms of a problem but often stalls when it comes to accessing the definitive evidence needed to identify the underlying root causes. This limitation underscores a common challenge in distributed systems: achieving comprehensive observability across heterogeneous data sources.
This article details a groundbreaking approach to extend the capabilities of the AWS DevOps Agent by constructing a custom Model Context Protocol (MCP) server. This innovative server acts as a crucial bridge, effectively closing the visibility gap that previously constrained the agent’s reach. Through a concrete, real-world example, we will demonstrate how to provide the AWS DevOps Agent with structured access to Amazon EKS worker node diagnostics. This same methodology can be universally applied to any data source that the agent cannot natively access, democratizing access to critical operational insights. By the conclusion of this comprehensive walkthrough, readers will possess the knowledge to deploy a fully functional MCP server that grants AWS DevOps Agent access to over 20 node-level log sources. This expansion not only enhances autonomous investigation capabilities but also dramatically assists in root cause analysis, offering a stark contrast in efficiency and depth compared to traditional, laborious manual SSH sessions and command-line troubleshooting.
The Evolving Landscape of Cloud Operations and AIOps
The rapid adoption of cloud-native architectures, characterized by microservices, containers, and Kubernetes, has ushered in unprecedented levels of agility and scalability. However, this complexity also presents significant operational challenges. Monitoring and troubleshooting distributed systems, where applications are composed of numerous interdependent services, can quickly become overwhelming. Traditional monitoring tools often struggle to provide the holistic view necessary for rapid incident resolution. Engineers spend an inordinate amount of time sifting through disparate logs, metrics, and traces, often under immense pressure during production incidents. Industry reports consistently highlight that mean time to resolution (MTTR) remains a critical metric, with prolonged downtime directly impacting revenue, customer satisfaction, and brand reputation.

This landscape has spurred the growth of AIOps (Artificial Intelligence for IT Operations), an approach that leverages AI and machine learning to automate and enhance IT operations processes. AIOps platforms aim to reduce alert fatigue, identify patterns indicative of emerging issues, and, increasingly, automate the investigation and remediation of incidents. The AWS DevOps Agent is a prime example of this trend, designed to bring intelligent automation to incident response. Its core value proposition lies in its ability to process vast amounts of data and apply reasoning to diagnose problems without explicit human instruction for every step. Yet, the inherent challenge for any AI system is access to comprehensive, high-fidelity data. If the data is siloed or inaccessible, even the most advanced AI agent will reach its limits. This is precisely the problem that the Model Context Protocol (MCP) aims to solve, by standardizing how AI agents can discover and interact with external data and tools.
Bridging the Observability Gap: Understanding the Model Context Protocol (MCP)
The Model Context Protocol (MCP) emerges as an open standard specifically designed to enable AI agents to discover and invoke external tools and data sources. AWS DevOps Agent’s support for custom MCP servers is a pivotal feature, as it allows organizations to extend the agent’s capabilities without requiring any modifications to the agent itself. When an MCP server is connected to the AWS DevOps Agent, a seamless integration process unfolds: the agent automatically discovers the available tools exposed by the server, comprehends their operational schemas, and integrates them into its autonomous investigation workflows. The operational burden shifts from the agent to the MCP server developer: you build and connect the MCP server, and the agent intelligently leverages its newly acquired capabilities.
The extensibility model underpinning MCP adheres to a clear, three-step methodology:
- Identify the Data Source: The initial step involves pinpointing specific data sources that the AWS DevOps Agent cannot natively access through its existing integrations. This might include operating system logs, proprietary diagnostic interfaces, or data from specialized third-party tools.
- Build the MCP Server: Next, a custom MCP server is developed. This server acts as an intermediary, encapsulating secure and structured access to the identified data source. It translates the raw, disparate data into a format that the AI agent can consume and interpret effectively.
- Connect to AWS DevOps Agent: Finally, the newly built MCP server is connected to the AWS DevOps Agent. This integration allows the agent to incorporate the new tools and data sources into its sophisticated investigation processes, thereby expanding its diagnostic reach.
Three fundamental design principles guide the successful implementation of this extensibility model:
- Return Structured Data, Not Raw Text: For an AI agent to effectively process and reason over data, it must be structured. The MCP server should pre-index findings with severity levels and stable identifiers. This enables the agent to efficiently filter, reference, and correlate information, moving beyond simple keyword searches to intelligent pattern recognition.
- Never Give the Agent a Shell: Security is paramount. The interaction between the agent and external systems must be mediated through a controlled, auditable execution model. Direct shell access to production systems is a significant security risk. Instead, interactions should be abstracted through secure APIs or predefined, parameterized commands that limit the agent’s potential blast radius.
- Make Tools Composable: The power of an AI agent lies in its ability to chain together multiple operations to build a comprehensive picture. Tools exposed via MCP should be designed such that their outputs can seamlessly serve as inputs to other tools. This composability fosters a "chain of evidence," allowing the agent to progressively gather more detailed information and refine its understanding of an incident.
AWS DevOps Agent: Autonomy and its Boundaries in EKS

AWS DevOps Agent’s native integrations with Amazon EKS provide a robust foundation for inspecting critical Kubernetes resources. It can scrutinize pod statuses, retrieve container logs, query Amazon CloudWatch Container Insights for performance metrics, and correlate various cluster events. This covers a wide spectrum of common issues, including application crashes, container-level resource exhaustion (CPU, memory), and configuration drift within the Kubernetes control plane. For many routine operational challenges, the agent’s native capabilities are sufficient, offering rapid diagnosis and insights.
However, a significant category of EKS production issues originates in a layer that these high-level Kubernetes-focused tools cannot inherently reach: the underlying worker node operating system. Critical artifacts such as iptables rules, full CNI (Container Network Interface) configuration and IP Address Management Daemon (IPAMD) state, system route tables, conntrack entries (for network connection tracking), dmesg kernel messages, containerd runtime logs, sysctl kernel parameters, Elastic Network Interface (ENI) metadata, and the unfiltered kubelet journal exist exclusively on the node itself. These low-level artifacts are often the primary, and sometimes the only, evidence available for diagnosing insidious issues such as IP allocation failures, elusive DNS resolution problems, complex network policy enforcement issues, persistent storage mount timeouts, and node registration failures. Without direct, structured access to this node-level data, the AWS DevOps Agent’s diagnostic capabilities, while advanced, remain incomplete. This highlights the crucial need for extensibility, especially in environments as complex and layered as Kubernetes on AWS.
Case Study: Unveiling Hidden EKS Node Issues with Custom MCP
To illustrate the profound impact of extending AWS DevOps Agent with a custom MCP server, we examine a realistic, yet challenging, node-level failure scenario within a test EKS cluster. This scenario involves a subtle network issue that is notoriously difficult to diagnose using standard Kubernetes tools alone, as pods outwardly appear healthy.
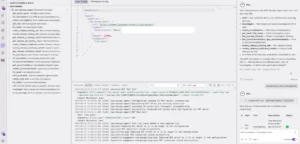
Setting the Stage: The Fault Injection
Our demonstration begins with an EKS cluster featuring a managed node group, where the AWS Systems Manager (SSM) Agent is running (a default inclusion on Amazon EKS optimized AMIs). A sample workload, a simple Nginx deployment, is deployed to one of the nodes within the demo-app namespace. The initial state shows all pods running, and kubectl commands indicate a healthy cluster.
The crucial step involves manually injecting a fault into one of the EKS worker nodes. This fault is designed to block pod DNS resolution at the iptables level. This is a particularly insidious type of issue because, from the perspective of kubectl, the pods continue to report a "Running" status. The applications within these pods, however, experience critical DNS resolution failures, leading to service degradation or outright outages. The root cause of this disruption is exclusively visible within the node’s iptables rules, a layer inaccessible to standard Kubernetes API calls. The fault injection commands, executed via SSM Session Manager for secure, auditable access, specifically target the FORWARD chain of iptables to drop UDP and TCP traffic destined for the kube-dns ClusterIP, effectively isolating pod DNS requests without affecting the node’s own DNS resolution. This perfectly simulates a real-world scenario where high-level monitoring appears normal, but deep-seated issues cripple applications.

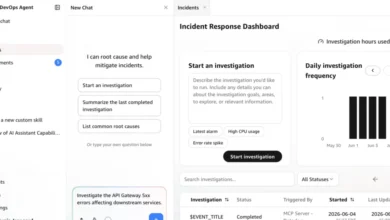
The Agent’s Autonomous Investigation in Action
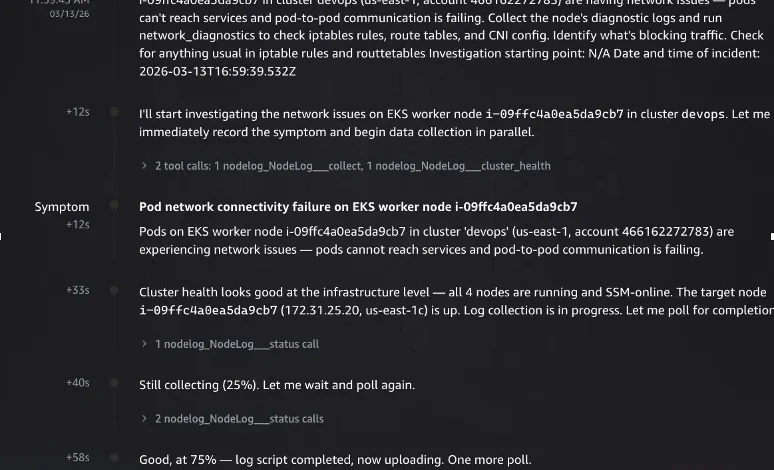
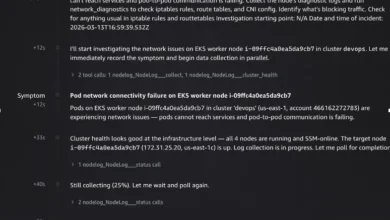
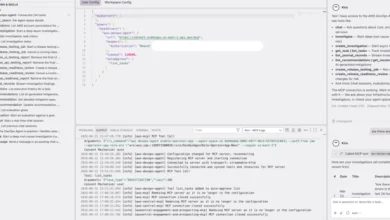
When an engineer observes the application-level DNS failures despite healthy pod statuses, they initiate an investigation with AWS DevOps Agent: "Pods on node i-xxxxxxxxxx in cluster EKS-sample (us-east-1) are running but applications report DNS resolution failures. Collect the node logs and investigate." The incident timestamp is also provided.
Upon receiving this prompt, the AWS DevOps Agent springs into action, recording the symptom and immediately launching parallel diagnostic actions. It first invokes the custom nodelog_collect tool (exposed via the MCP server) to gather comprehensive node logs from the affected instance. Concurrently, it performs a standard cluster health check, confirming that all four nodes in the cluster are operational and registered with SSM. The agent intelligently polls the log collection status, providing real-time progress updates (e.g., 25%, 75% complete). Once log collection is finalized, the agent initiates multiple parallel workstreams to maximize diagnostic coverage and minimize time-to-root-cause. These include running network diagnostics, performing quick triage checks, and critically, collecting logs from a known-healthy node for comparative analysis.
The parallel investigation phase is where the MCP server’s extended capabilities truly shine. The agent launches four concurrent deep-dive tasks:
deep-dive-iptables-routes: This task meticulously examines the node’s firewall rules and routing table, executing 8 tool calls and completing in approximately 1 minute 44 seconds.search-network-errors: Over a duration of 7 minutes 51 seconds, this task performs 15 tool calls to scan the collected logs for any network-related error patterns.collect-healthy-node: This crucial task gathers identical diagnostics from a known-good node for direct comparison, involving 13 tool calls over 4 minutes 55 seconds.check-oom-and-pod-status: Executing 19 tool calls over 8 minutes 12 seconds, this task investigates kernel Out-Of-Memory (OOM) kills and detailed pod health.
Each of these tasks, powered by the custom MCP server, generates a structured report, which the agent then uses for final synthesis.
Root Cause Identified: A Multi-Vector Disruption
The iptables and route table deep-dive, enabled by the custom MCP server, definitively uncovers the root cause. The agent identifies two "CRITICAL" findings: a FAULT-INJECT-DROP-POD-TO-POD rule in the FORWARD chain that explicitly drops inter-pod traffic, and a FAULT-INJECT-DROP-SERVICE-CIDR rule that similarly drops forwarded traffic to the Kubernetes service CIDR range. It also flags a "MEDIUM" severity finding: a blackhole route for 10.96.0.0/12 (the Kubernetes service CIDR) that is conspicuously absent on healthy nodes. Other checks, such as kube-proxy chains, AWS VPC CNI SNAT/CONNMARK configurations, and default gateway/ENI route tables, are confirmed to be normal, allowing the agent to immediately focus on the critical anomalies.
The healthy node comparison further solidifies the diagnosis. By comparing the unhealthy node against a known-good node across seven dimensions (security groups, ENI count, DNS configuration, iptables rules, route tables, conntrack entries, and IPAMD state), the agent highlights definitive differences. The blackhole route for 10.96.0.0/12 is exclusively present on the unhealthy node. Kubelet API server timeout errors appear only on the unhealthy node. Conntrack entries are significantly higher (1,962 vs. 169), and IPAMD reconciliation errors are five times more frequent. Crucially, the iptables FORWARD chain counters on the unhealthy node show 2.4 billion packets processed versus zero on the freshly-started healthy node, unequivocally confirming sustained traffic disruption.

Ultimately, the agent synthesizes these findings into a precise root cause determination. It identifies a "fault-injection namespace" on the EKS cluster, responsible for running chaos experiments. These experiments introduced three specific network-disrupting modifications on the target node: (1) a FAULT-INJECT-DROP-POD-TO-POD iptables rule in the FORWARD chain, (2) a FAULT-INJECT-DROP-SERVICE-CIDR rule for the Kubernetes service CIDR, and (3) a blackhole route for 10.96.0.0/12. This "multi-vector network disruption" explains why pods appear to be running but cannot communicate with each other or reach essential Kubernetes services, including kube-dns. This comprehensive, automated diagnosis, achieved in minutes, would typically take hours of manual effort, if discovered at all.
Architecting Extensibility: The EKS Node Diagnostics MCP Server
The sample-eks-node-diagnostics-mcp repository provides a robust reference implementation for this pattern. This MCP server delivers structured access to node-level diagnostic data, leveraging AWS Systems Manager (SSM) Automation for secure and auditable execution.
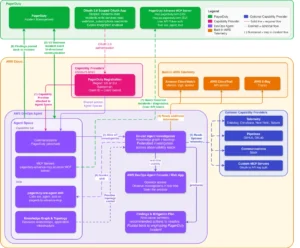
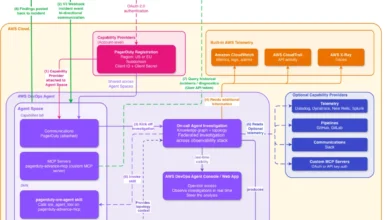
Secure Tool Invocation via SSM Automation
The architecture is designed for security and scalability. AWS DevOps Agent connects via MCP/HTTPS to AgentCore Gateway. This gateway, secured by Amazon Cognito OAuth 2.0, authenticates incoming requests and routes tool calls through a Lambda-based Tool Router to SSM Automation. SSM Automation then dispatches pre-defined runbooks to the EKS worker nodes, which must be running the SSM Agent. The SSM Agent executes the runbooks, collects the requested log archives, and uploads them to a KMS-encrypted S3 bucket. An S3 event triggers a Lambda function that extracts and indexes the findings, making them queryable by the agent. This entire process ensures that AWS DevOps Agent never gains direct shell access to the node; every interaction is mediated through the auditable, IAM-controlled, non-interactive SSM Automation execution model. The server exposes 19 tools for log collection, pre-indexed error retrieval, cross-file search, structured network diagnostics, and live packet capture. A typical agent workflow orchestrates these tools: collect → status → errors → search → correlate → read → summarize, with outputs chaining into subsequent steps.
Connecting via Amazon Bedrock AgentCore Gateway
The reference implementation strategically utilizes Amazon Bedrock AgentCore Gateway to expose the Lambda-backed MCP server to AWS DevOps Agent. AgentCore Gateway simplifies this integration by converting standard Lambda functions into MCP-compatible tools, managing authentication, protocol translation, and tool discovery through a single, managed endpoint. The integration follows three steps:
- OAuth Authorizer with Amazon Cognito: A Cognito User Pool is provisioned, configured for the OAuth 2.0 client credentials flow. This robustly secures inbound access to the gateway, ensuring only clients with valid tokens can invoke tools.
- Gateway Creation and Lambda Registration: The Lambda function responsible for handling tool invocations is registered as a target on the gateway. AgentCore Gateway automatically discovers the tool schemas from the Lambda and exposes them via the MCP protocol. The gateway endpoint then becomes the single MCP URL for AWS DevOps Agent.
- Connecting AWS DevOps Agent: The MCP server is registered at the account level within the AWS DevOps Agent console, providing the gateway URL and OAuth configuration. Specific tools are then allowlisted for each Agent Space. AWS DevOps Agent authenticates by obtaining a JWT from the Cognito token endpoint using the client credentials grant, passing it as a Bearer token in requests to the gateway URL.
Deployment Overview
The entire stack is deployed using AWS CDK. A deploy.sh script guides the user through cluster selection and node role configuration, requiring the target EKS cluster name, the IAM role ARN attached to worker nodes, and the AWS Region. The script outputs the MCP gateway URL, OAuth credentials, and token endpoint—all necessary for configuring the connection in AWS DevOps Agent.

Beyond EKS: Generalizing the Extensibility Pattern
While the EKS node diagnostics use case powerfully demonstrates the pattern, its architecture is remarkably generalizable. This approach can be extended to any system where the SSM Agent is running and a corresponding SSM Automation runbook can be defined to collect the necessary data.
For instance, a standard EC2 instance running the SSM Agent can leverage this exact methodology. Organizations can collect OS-level logs, intricate network configurations, package states, or application-specific diagnostics through custom or pre-built SSM Automation runbooks. The collected results are uploaded to S3, processed, and then exposed through MCP tools for autonomous investigation. The same principle applies to ECS container instances (for Docker daemon logs, ECS agent state, or specific iptables rules), on-premises servers registered via SSM Hybrid Activations, or any other managed node in an organization’s fleet.
Furthermore, the pattern extends beyond SSM-managed hosts. Network devices, for example, can be integrated by making API calls to their management planes. Databases can be queried for read-only diagnostic information, and third-party Application Performance Monitoring (APM) tools can be integrated via their vendor API integrations. In each of these diverse scenarios, the core three-step approach remains consistent: identify the data source that AWS DevOps Agent cannot natively access, build an MCP server to wrap secure and structured access to that data, and connect it to AWS DevOps Agent.
Strategic Implications and Future Outlook
The introduction of MCP-based extensibility for AWS DevOps Agent carries significant strategic implications for IT operations and the broader AIOps landscape.

- Reduced MTTR and Operational Costs: By automating deep-dive investigations into previously inaccessible data sources, organizations can dramatically reduce Mean Time To Resolution (MTTR). Faster incident resolution translates directly into reduced downtime costs, improved service level agreement (SLA) adherence, and enhanced customer satisfaction. The shift from manual, time-consuming troubleshooting to autonomous investigation frees up highly skilled engineers to focus on preventative measures and innovation.
- Enhanced Observability and Reliability: This pattern closes critical observability gaps, providing a more comprehensive view of system health, particularly at the often-overlooked OS and infrastructure layers. This enhanced visibility directly contributes to improved system reliability and resilience.
- Empowering AIOps: MCP accelerates the evolution of AIOps by providing a standardized, secure, and scalable mechanism for AI agents to interact with the vast and diverse universe of operational data. It moves AIOps beyond simple anomaly detection to sophisticated, multi-source root cause analysis.
- Security by Design: The reliance on SSM Automation for execution ensures that all interactions are auditable and adhere to the principle of least privilege. The agent never gains direct, unmediated access to underlying infrastructure, significantly reducing security risks associated with automated diagnostics.
Considerations for Adoption and Best Practices
This approach is highly effective for incident response scenarios where diagnostic data resides outside AWS DevOps Agent’s native integrations, for fleet-wide triage where manual access is impractical, and for cross-source correlation spanning multiple log types. It is not, however, a replacement for continuous monitoring solutions (like CloudWatch Container Insights or Prometheus for real-time alerting), robust log shipping for compliance and long-term retention, or scenarios where the agent already possesses native access to the data source.
Prospective users must ensure that SSM Agent is running on target nodes with appropriate IAM permissions. The reference implementation serves as a proof of concept and should be thoroughly validated in non-production environments before deployment with production workloads.
Conclusion
The Model Context Protocol (MCP) represents a powerful, standardized extensibility mechanism that allows organizations to bridge critical visibility gaps in AWS DevOps Agent without necessitating any modifications to the agent itself. The pattern is elegant in its simplicity and profound in its impact: identify the unreachable data source, construct an MCP server to encapsulate secure and structured access to it, and integrate this server with AWS DevOps Agent through Amazon Bedrock AgentCore Gateway. The AWS DevOps Agent intelligently handles the reasoning and orchestration, while the MCP server efficiently manages the complex data access and transformation. This synergy unlocks a new era of autonomous, comprehensive incident investigation, significantly reducing MTTR and enhancing operational efficiency across complex cloud environments.
To embark on this journey of enhanced autonomous investigation:

- Explore the
sample-eks-node-diagnostics-mcprepository for a practical, deployable example. - Review the AWS DevOps Agent documentation to understand the agent’s core capabilities and integration points.
- Familiarize yourself with Amazon Bedrock AgentCore Gateway for secure and scalable MCP server exposure.
- Consider your specific operational challenges and identify critical data sources currently beyond your AWS DevOps Agent’s reach.
This extensibility model not only solves immediate diagnostic challenges but also paves the way for a future where AI agents can truly achieve comprehensive observability and autonomous problem resolution across the entire technology stack.

