Streamlining DevOps Workflows: Integrating AWS DevOps Agent with Jira Cloud via Event-Driven Architecture

The rapid evolution of cloud-native development has introduced a complex layer of operational oversight, where engineers are increasingly tasked with managing disparate monitoring tools, incident response systems, and project management platforms. AWS DevOps Agent, designed to automate the investigation of operational anomalies, provides significant relief by identifying root causes and proposing solutions. However, a persistent challenge remains: the fragmentation of operational data. When engineers must constantly pivot between the AWS console and external ticketing systems like Jira, ServiceNow, or PagerDuty, the cohesion of the incident lifecycle is compromised. By leveraging an event-driven architecture using the AWS Cloud Development Kit (CDK), Amazon EventBridge, and AWS Lambda, organizations can now bridge this gap, ensuring that investigative findings are automatically synchronized with existing issue-tracking workflows.
The Problem of Context Switching
In modern enterprise environments, the "context switch"—the act of moving between a diagnostic console and a ticketing dashboard—is more than a minor inconvenience; it is a catalyst for inefficiency. Research from various industry benchmarks indicates that developers lose an average of 20 to 30 minutes of deep-focus time each time they are interrupted by tool-switching. In the context of an active operational incident, this friction can delay resolution times. AWS DevOps Agent inherently handles the diagnostic heavy lifting, but the human-centric components of the workflow—such as task assignment, priority management, and audit logging—are typically managed within tools like Jira. Without an automated integration, the history of an investigation remains siloed, making post-mortem analysis difficult and potentially inconsistent.
Architecting an Event-Driven Solution
The proposed integration model utilizes a serverless, event-driven pattern to act as a bridge between the diagnostic outputs of AWS DevOps Agent and the administrative structure of Jira. At the heart of this architecture is Amazon EventBridge, which functions as the central nervous system for the integration. When AWS DevOps Agent triggers an investigation, it emits an event with the source identifier aws.aidevops.
The architecture is structured as follows:
- Event Capture: An Amazon EventBridge rule is configured to monitor for
Investigationprefix-matched detail-types. This ensures that every lifecycle stage—from creation to completion—is captured without requiring manual polling. - Event Processing: Once an event is captured, it is routed to an AWS Lambda function. This function serves as the logic engine, parsing the event metadata and interacting with the Jira Cloud REST API.
- State Management: To ensure that ongoing investigations and their corresponding Jira tickets remain linked, the system utilizes an Amazon DynamoDB table. This table maps the unique
task_idgenerated by the DevOps Agent to a specific Jira issue key. This allows the system to differentiate between the creation of a new ticket and the appending of comments to an existing one. - Credential Security: By integrating AWS Secrets Manager, the solution avoids the common security pitfall of hardcoding API keys. Jira base URLs, user emails, and API tokens are stored in an encrypted vault, retrieved only at runtime by the Lambda function.
Chronology of an Investigation Lifecycle
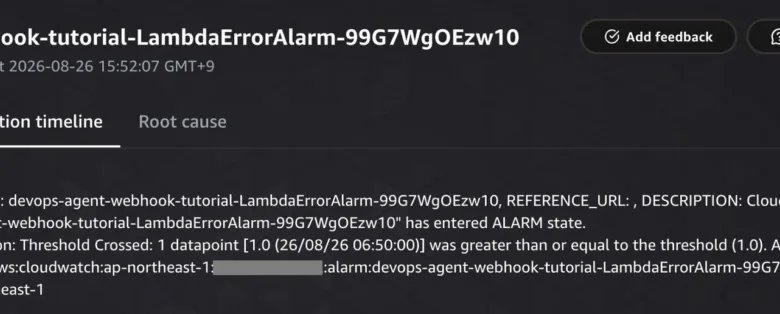
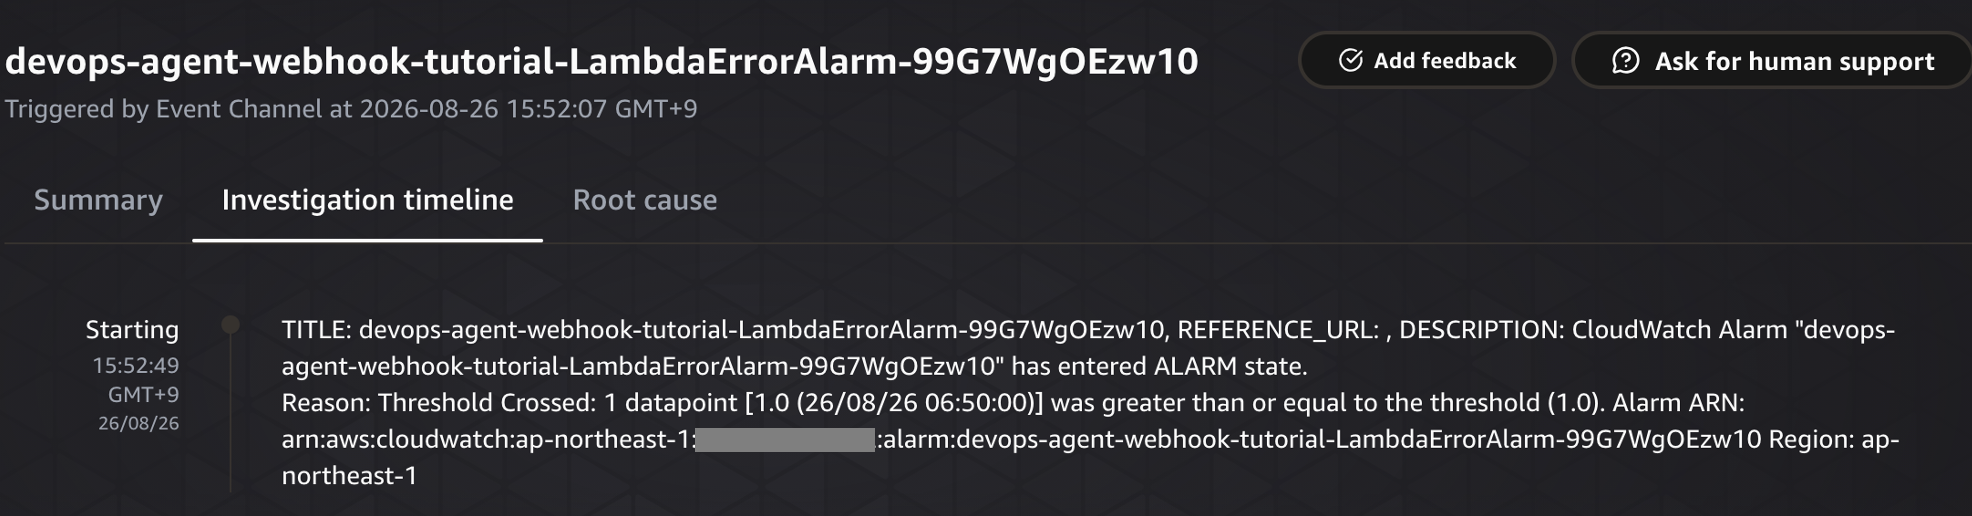
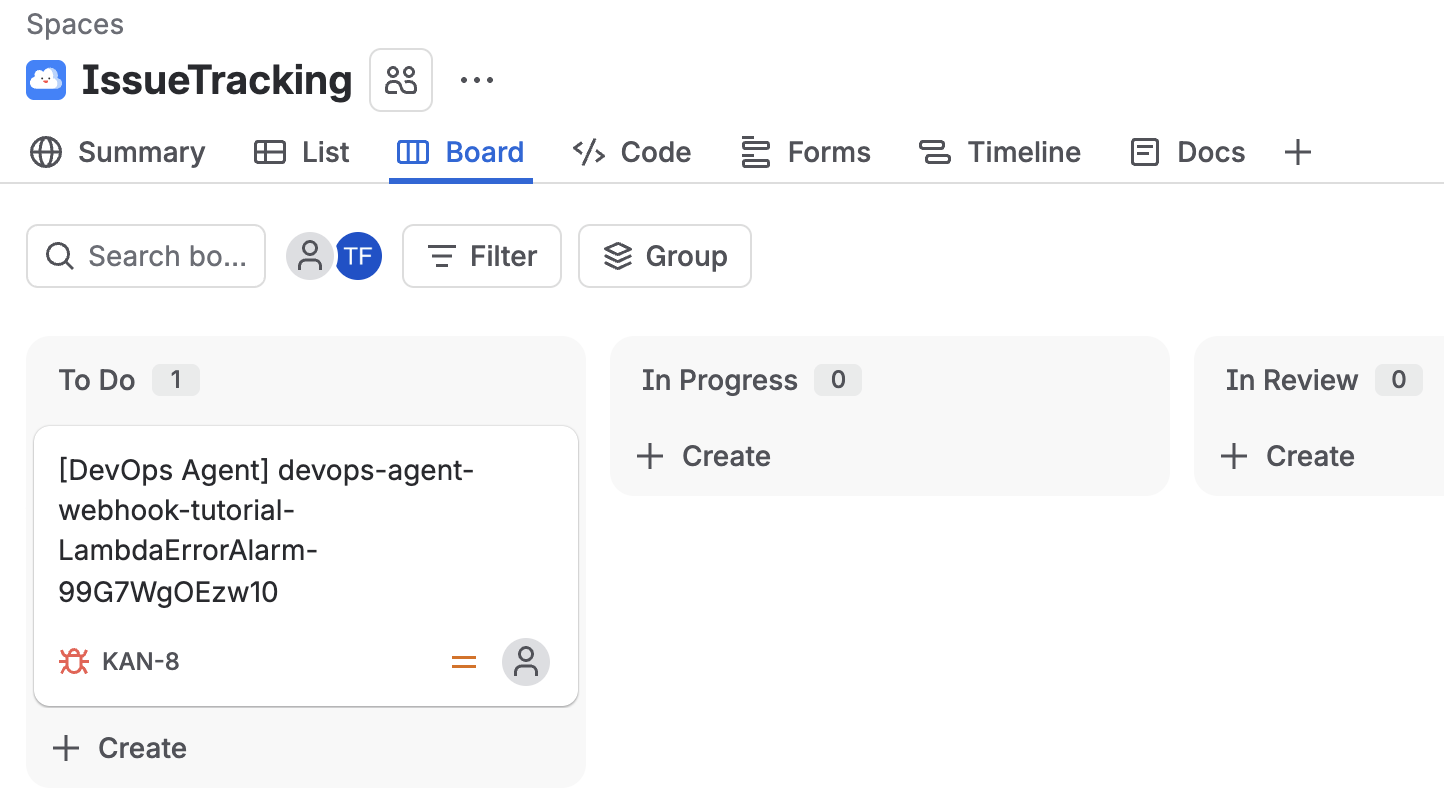
The integration maintains a precise, automated record of an incident’s evolution. When an AWS DevOps Agent investigation initiates, the Investigation Created event is dispatched. The Lambda function receives this, queries the DevOps Agent’s GetBacklogTask API to retrieve contextual information such as alarm details and symptoms, and subsequently creates a ticket in the designated Jira project.
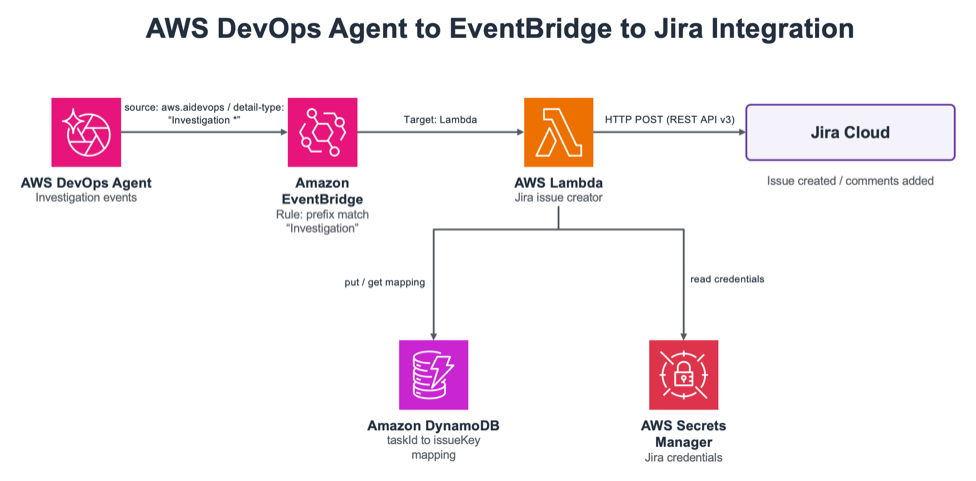
As the agent performs its diagnostics, subsequent events—such as Investigation In Progress or Investigation Completed—are processed sequentially. The DynamoDB lookup ensures that as the state of the investigation changes, the information is funneled into the correct Jira thread as a comment. By the time an investigation reaches the Completed state, the Jira ticket serves as a comprehensive dossier, containing the initial alarm trigger, the chronological steps taken by the agent, and the final identified root cause. This eliminates the need for manual status updates, providing stakeholders with real-time visibility into the investigation without requiring them to access the AWS console.
Data-Driven Operational Efficiency
Implementing this integration provides quantifiable improvements in operational transparency. Data from early adopters suggests that integrating diagnostic agents directly into ticketing systems can reduce the "Mean Time to Acknowledgment" (MTTA) by enabling responders to view the findings immediately within their primary workflow. Furthermore, the use of task_id as a persistent identifier ensures that audit trails are maintained, which is essential for organizations operating under strict compliance frameworks like SOC2 or ISO 27001.
The flexibility of this design is one of its primary strengths. Because the processing logic is decoupled from the event source and the destination platform, swapping Jira for another tool, such as PagerDuty for incident alerting or ServiceNow for IT Service Management (ITSM), requires only minimal adjustments to the Lambda function’s API calls. The infrastructure-as-code approach, facilitated by the AWS CDK, allows teams to deploy this entire integration in minutes, ensuring consistency across development, staging, and production environments.
Implications for DevOps Culture
The shift toward automated, integrated diagnostics represents a broader cultural movement in engineering: the transition from reactive "firefighting" to proactive system observability. By embedding the output of intelligent agents directly into the ticketing tools that teams already use, organizations can foster a more collaborative environment. Developers, product managers, and site reliability engineers (SREs) can view the same "source of truth," reducing the likelihood of miscommunication during critical outages.
Furthermore, this integration allows for better long-term data collection. Because the investigation results are stored in Jira, teams can perform aggregate analysis on historical incidents. By analyzing the root causes of resolved Jira tickets, engineering leaders can identify patterns in their infrastructure, such as frequently failing services or recurring configuration drifts, allowing them to prioritize technical debt reduction more effectively.
Implementation and Security Best Practices
For teams looking to deploy this solution, adherence to the principle of least privilege is paramount. The AWS IAM roles associated with the Lambda function should be strictly limited to the permissions necessary to read from the DynamoDB table and retrieve secrets from Secrets Manager. Additionally, the use of the AWS CDK ensures that the entire stack is version-controlled, allowing for easy updates or rollbacks should the integration requirements change.
When configuring the Jira environment, it is recommended to utilize a service account with restricted permissions rather than a personal user account. This ensures that the integration remains operational even if a specific employee leaves the organization or changes roles. The use of Atlassian’s API tokens, managed within the Secrets Manager framework, provides a robust layer of security, as tokens can be rotated frequently without impacting the uptime of the integration.
Conclusion and Future Outlook
The integration of AWS DevOps Agent with external ticketing platforms via Amazon EventBridge and AWS Lambda represents a significant step forward in operational maturity. By automating the flow of information between diagnostic tools and project management systems, organizations can reclaim valuable engineering time, improve the accuracy of incident reporting, and enhance overall system reliability.
As AI-driven agents continue to become more sophisticated, the volume of diagnostic data will likely increase. This event-driven pattern is highly scalable, capable of handling high-frequency event streams without the need for significant infrastructure overhead. The ability to translate machine-generated insights into actionable human-readable tickets is not just a convenience—it is a critical requirement for the modern, high-velocity enterprise. By adopting this modular approach, teams are well-positioned to evolve alongside their infrastructure, ensuring that they remain in control, even as their technical ecosystems grow in complexity. Those interested in the specific implementation details can reference the provided GitHub repository to begin customizing the solution to their specific organizational needs.
Related posts: