Code Coverage: How to Measure It, Understand the Metrics, and Improve Your Tests

Code coverage, a critical metric in software development, is often discussed but rarely utilized to its full potential by development teams. Whether managing a complex SaaS product or maintaining a legacy monolith, a clear understanding of what test suites genuinely exercise—and crucially, what they miss—can be the deciding factor between a smooth, confident product release and a late-night incident requiring urgent attention. This comprehensive guide delves into the core coverage metrics, outlines modern measurement techniques, and provides actionable strategies for enhancing code coverage effectively, ensuring testing efforts are focused on areas that truly matter.
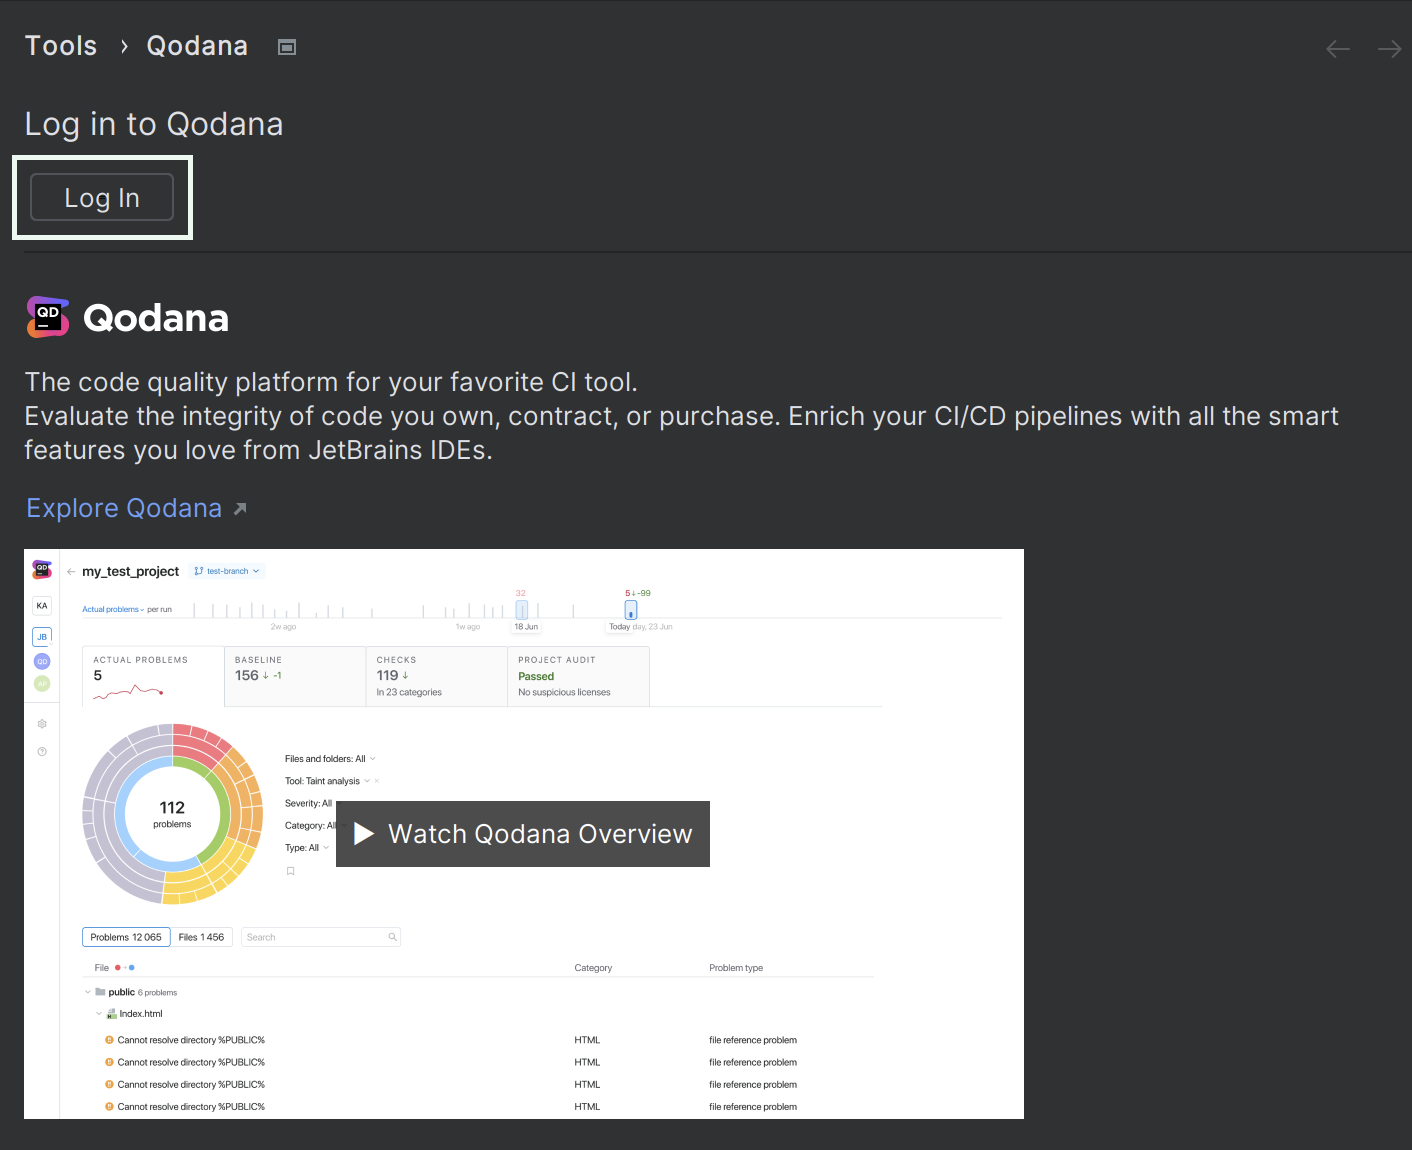
The significance of robust code quality platforms cannot be overstated in today’s rapid development cycles. JetBrains, through its Qodana platform, offers a specialized code quality solution for teams, emphasizing the importance of integrated tools in achieving high standards. Qodana Ultimate and Qodana Ultimate Plus licenses notably provide comprehensive code coverage reporting capabilities, enabling teams to gain deeper insights into their test suites.
The Foundational Metric: What is Code Coverage?

At its core, code coverage quantifies the percentage of a codebase executed during testing. For instance, if a software project comprises 1,000 executable lines of code and its associated test suite successfully runs 900 of these lines, the project achieves 90% line coverage. This metric is typically expressed as a percentage and serves as a runtime indicator, tracking actual execution rather than merely identifying potential structural issues.
This characteristic distinguishes code coverage from static code analysis, which involves inspecting source code without execution to identify issues like complexity, style inconsistencies, or potential security vulnerabilities. Both methodologies are complementary: static analysis flags areas where problems might exist, while code coverage confirms whether existing tests actually reach and exercise those potentially problematic sections. This dual approach provides a more holistic view of code health and test effectiveness.
It is crucial to differentiate between "code coverage" and "test coverage." While often used interchangeably, they represent distinct concepts:
- Code Coverage: A quantitative measure focusing on the amount of code executed by tests. It answers the question: "How much of my code did my tests touch?"
- Test Coverage: A qualitative measure assessing the thoroughness of tests in validating specified behaviors and requirements. It asks: "How thoroughly did my tests validate the intended functionality?"
For example, a test suite might achieve 95% line coverage on a payment processing module. However, if no test case specifically validates the system’s behavior when a transaction fails due to insufficient funds, the test coverage for that critical scenario remains incomplete, despite high code coverage. Code coverage, therefore, primarily helps in identifying untested code segments, guiding developers to focus their testing efforts on critical areas such as authentication, data access layers, and error handling. By measuring code coverage, teams can uncover overlooked execution paths and edge cases that could harbor regressions or security flaws.

Consider a simple JavaScript function:
function foo(a, b)
  let c = 42;
  if (a > 0 && b > 0)
    c = c + a * b;
   else
    c = c - (a + b); // This 'else' branch

  return c;
If the only test calls foo(1, 1), every line appears to execute, leading to 100% line coverage. However, the else branch, which handles non-positive inputs, is never tested. While line coverage might seem complete, a more granular metric like branch coverage would immediately highlight this testing gap.
Unpacking the Core Coverage Metrics: A Deeper Dive
Coverage criteria are formal rules that define the thoroughness of code execution during testing. Rather than attempting to achieve perfection across all metrics simultaneously, development teams typically achieve better outcomes by selecting a focused set of primary coverage metrics aligned with their project’s risk profile and concentrating their efforts there. The most common coverage types include:

- Line/Statement Coverage: This is the most fundamental metric, checking whether each executable line or statement of code has been invoked during testing. It serves as an excellent baseline for dashboards and provides an initial overview of what parts of the code are exercised. Most tools report line and statement coverage as a single percentage. While easy to understand, high line coverage does not inherently guarantee high quality or comprehensive testing.
- Function Coverage: This metric verifies that each function, method, or subroutine within the codebase has been called at least once by the test suite. It is particularly useful for identifying "dead code"—functions that are never invoked and thus potentially redundant or obsolete—or functions that lack any form of testing.
- Branch Coverage (Decision Coverage): Going a step further than line coverage, branch coverage determines how many branches of control structures (e.g.,
if/elsestatements,switchcases, loops) have been executed. For anifstatement, it ensures that both thetrueandfalsepaths have been traversed. This metric is crucial for validating decision logic and ensuring that different outcomes of conditional statements are tested. - Condition Coverage: This metric tests how many boolean sub-expressions within a compound conditional statement have been evaluated for both
trueandfalseoutcomes. For a complex expression likeif (a && b || c), condition coverage demands that each sub-expression (a,b,c) independently evaluates to both true and false across various test cases. This can uncover missing tests that branch coverage alone might not reveal, especially in intricate logical predicates. - Path Coverage: This is the most exhaustive coverage metric, aiming to test all possible execution paths through a given section of code. For non-trivial applications, achieving full path coverage is often practically impossible due to combinatorial explosion—the number of potential paths multiplies exponentially with loops and nested branches. Consequently, path coverage is typically reserved for highly critical algorithms or security-sensitive components where absolute certainty of execution paths is paramount.
While line coverage provides a quick, easily digestible metric, it can be misleading. For instance, if a project has five functions, four of which are single-line, and one is a complex 100-line function, testing only the 100-line function might yield a high line coverage percentage (almost 100%) but a very low function coverage (20%). This illustrates the necessity of considering multiple metrics.
In safety-critical industries, such as aerospace, automotive, and medical devices, more stringent criteria like Modified Condition/Decision Coverage (MC/DC) are often mandated. Standards like DO-178C for avionics software require MC/DC for Level A software, ensuring that each condition within a decision independently affects the decision’s outcome, demonstrating a robust level of test rigor that goes far beyond basic line or branch coverage.
The Evolution and Importance of Code Coverage in Modern Development
The concept of code coverage emerged in the early days of software testing as a way to quantify the effectiveness of test suites. Initially, it was a manual or semi-manual process, but with the advent of automated testing frameworks and continuous integration/continuous delivery (CI/CD) pipelines, code coverage analysis became an indispensable part of the modern software development lifecycle. The shift towards agile methodologies and DevOps practices further propelled its importance, emphasizing continuous feedback and quality assurance throughout the development process.
Today, code coverage is more than just a metric; it’s a cornerstone of software quality assurance. It empowers teams to:
- Reduce Risk: By identifying untested code, teams can proactively address potential vulnerabilities and reduce the likelihood of critical defects reaching production. This is especially vital in regulated industries where compliance mandates rigorous testing.
- Improve Code Quality: Focusing on uncovered areas often leads to better-designed, more modular, and easier-to-test code. Refactoring complex, untestable sections naturally improves overall code health.
- Optimize Testing Efforts: Instead of randomly adding tests, coverage data directs efforts to areas where they will have the most impact, preventing redundant tests and maximizing the return on testing investment.
- Enhance Collaboration: Shared coverage reports provide a common understanding of test status across development, QA, and management teams, fostering a collaborative approach to quality.
- Support Regulatory Compliance: For industries governed by strict regulations (e.g., ISO 26262 for automotive, DO-178C for aerospace), demonstrating specific levels of code coverage is often a mandatory requirement.
The integration of code coverage tools into CI/CD pipelines has transformed it from a post-mortem analysis tool into a preventative measure, allowing developers to receive immediate feedback on the testability and coverage of their new code changes.
Practical Application: Measuring Code Coverage
Measuring code coverage involves a structured approach, typically encompassing four key steps:
- Instrumenting the Code: This initial step involves preparing the source code or compiled binaries to track execution. Instrumentation adds special hooks or probes that record which lines, branches, or functions are executed during runtime. This process is usually automated by coverage tools.
- Running Tests: Execute the test suite (unit, integration, or even end-to-end tests) against the instrumented application. As the tests run, the instrumentation collects data on every piece of code that is touched.
- Generating Reports: Once testing is complete, the collected execution data is processed to generate detailed coverage reports. These reports typically display coverage percentages for various metrics (line, branch, function) and often highlight uncovered code segments in the source files.
- Analyzing and Acting: Developers and QA teams analyze these reports to identify areas with low coverage, understand the reasons for the gaps, and plan strategies for writing additional tests or refactoring code to improve testability and coverage.
Qodana, for instance, supports coverage reports generated by a wide array of popular tools across different programming languages and ecosystems, ensuring broad compatibility. These tools include:
- Java/JVM: JaCoCo, IntelliJ IDEA’s native coverage runner
- .NET: dotCover, Coverlet
- JavaScript/TypeScript: Istanbul (nyc), Jest, Vitest
- Python: Coverage.py
- Go:
go test -cover - PHP: PHPUnit with Xdebug
These tools typically output coverage data in standard formats (e.g., XML, HTML, LCOV), which can then be consumed and visualized by platforms like Qodana. Qodana’s documentation provides specific, language-tailored configuration instructions, streamlining the integration process for various projects. The core output from these tools is typically a percentage, indicating the proportion of code elements (lines, branches, functions) that were exercised. While line coverage provides a basic understanding of what was executed, branch coverage offers deeper insights into the thoroughness of testing for decision logic. The ultimate goal is to surface these results efficiently—whether through pull request comments, IDE plugins, or centralized CI dashboards—allowing developers to act promptly.
Beyond the Percentage: Interpreting Code Coverage Results
Headline code coverage percentages, while easy to grasp, can be deceptive if viewed in isolation. A project boasting 85% line coverage might, for example, still exhibit only 55% branch coverage, indicating that significant portions of complex decision logic remain inadequately tested. Code coverage metrics are indicators of test execution rather than test quality. A test that merely executes every line of code without asserting meaningful behavior provides a false sense of security, failing to validate actual functionality.
So, what constitutes "good" code coverage? There are practical guidelines rather than a universal magic number:
- Context is King: The ideal coverage percentage varies significantly based on the project’s domain, criticality, and maturity. A simple marketing website might tolerate lower coverage than a financial trading system or medical software.
- Risk-Based Approach: Prioritize coverage in critical components (e.g., payment gateways, security modules, core business logic) over less critical areas (e.g., UI components, generated code, simple data models). Aim for higher coverage (e.g., 90-95% branch coverage) in high-risk modules, while a lower threshold (e.g., 60-70% line coverage) might be acceptable for less critical utilities.
- Industry Standards: For many commercial applications, aiming for 80% line and branch coverage is widely considered a healthy industry standard for critical business logic. However, reaching 100% code coverage does not equate to bug-free code; it merely confirms that every line was touched, not that every conceivable behavior was validated correctly.
- Trend Over Time: Treat code coverage as a trend indicator. Monitoring coverage week-over-week or sprint-over-sprint helps teams identify regressions promptly. A sudden drop in coverage indicates new, untested code or removed tests, signaling potential risks associated with legacy or newly introduced code. Dashboards that visualize these trends are invaluable for spotting quality erosion before it compounds.
Microsoft Research, in a comprehensive study examining over 100 large open-source Java projects, found an insignificant correlation between high coverage and fewer post-release defects at the file level. This critical finding underscores that while coverage is a necessary component of a robust quality strategy, it is not sufficient on its own. It must be balanced with other quality metrics, including defect trends, incident post-mortems, static analysis warnings, and real-time production monitoring.
Strategic Improvement: Elevating Code Coverage Without Compromising Quality
To genuinely enhance code coverage, it must be approached as a practical, strategic initiative rather than an abstract numerical target. The focus should always remain on improving software quality, with coverage acting as a guiding metric. Here’s a step-by-step approach:
- Leverage Coverage Reports: Begin by thoroughly analyzing existing coverage reports. Identify areas of the codebase with low coverage, particularly focusing on high-risk modules such as core domain services, payment processing logic, and data access layers. Resist the temptation to uniformly raise the global coverage percentage; target specific, impactful areas first.
- Prioritize Focused Unit Tests: Unit tests are highly effective for rapidly increasing code coverage because they target isolated, pure functions and small components. Utilize popular testing frameworks (e.g., JUnit 5 for Java, pytest for Python, Jest for JavaScript) to write granular tests for functions identified as having high business impact or low existing coverage.
- Target Uncovered Branches and Conditions: Move beyond simple line coverage. Actively write test cases that specifically exercise error paths, retry logic, timeout handling, and edge cases within complex conditional statements. This strategic approach significantly boosts coverage at the branch and condition levels, where many subtle bugs tend to reside.
- Refactor Overly Complex Code: Functions or methods exhibiting high Cyclomatic Complexity are inherently difficult to test and achieve high coverage for. Splitting these monolithic units into smaller, more focused, and testable components not only improves coverage numbers but also enhances overall code readability, maintainability, and static analysis findings.
- Strategically Handle Hard-to-Test Code: For challenging areas like third-party integrations, legacy modules with tight coupling, or code heavily reliant on external I/O, employ advanced testing strategies. Techniques such as dependency injection, mocking, stubbing, and contract testing enable the creation of isolated test environments without requiring full external systems.
- Integrate Coverage Checks into CI/CD: Embed code coverage tools directly into your continuous integration pipeline. Set realistic coverage goals (e.g., 80% for new code, or a "no significant regression" policy). Configure CI systems (like GitHub Actions, GitLab CI/CD, Azure DevOps) to enforce these "coverage status checks" on every pull request, preventing new code from lowering overall coverage.
- Set Realistic, Module-Specific Goals: Acknowledge that not all parts of a codebase warrant the same level of testing rigor. Instead of a blanket global target, establish specific, risk-adjusted coverage goals for individual modules or components. For instance, a critical banking transaction module might aim for 95% branch coverage, while a simple data serialization utility might target 75% line coverage.
A critical caveat: avoid writing superficial tests solely to inflate coverage percentages. The purpose of tests is to assert meaningful behavior, validate edge cases, and confirm error conditions—not merely to execute lines of code. Code coverage is a powerful tool for improving code reliability and verifying critical paths, but only when the underlying tests are robust, relevant, and well-designed. It strengthens quality assurance by measuring test thoroughness, not by artificially boosting numbers.
Seamless Integration: Code Coverage in CI/CD and Static Analysis Workflows
The true power of code coverage is unleashed when it is seamlessly integrated into modern development workflows, particularly alongside static code analysis and CI/CD pipelines. This combination provides a comprehensive, multi-faceted view of code health: runtime execution metrics (from coverage) coupled with structural and style checks (from static analysis) across various programming languages.
Qodana Cloud Integration
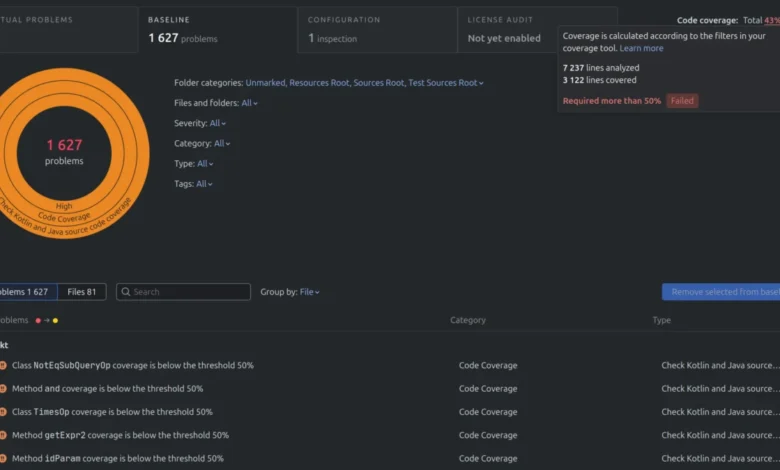
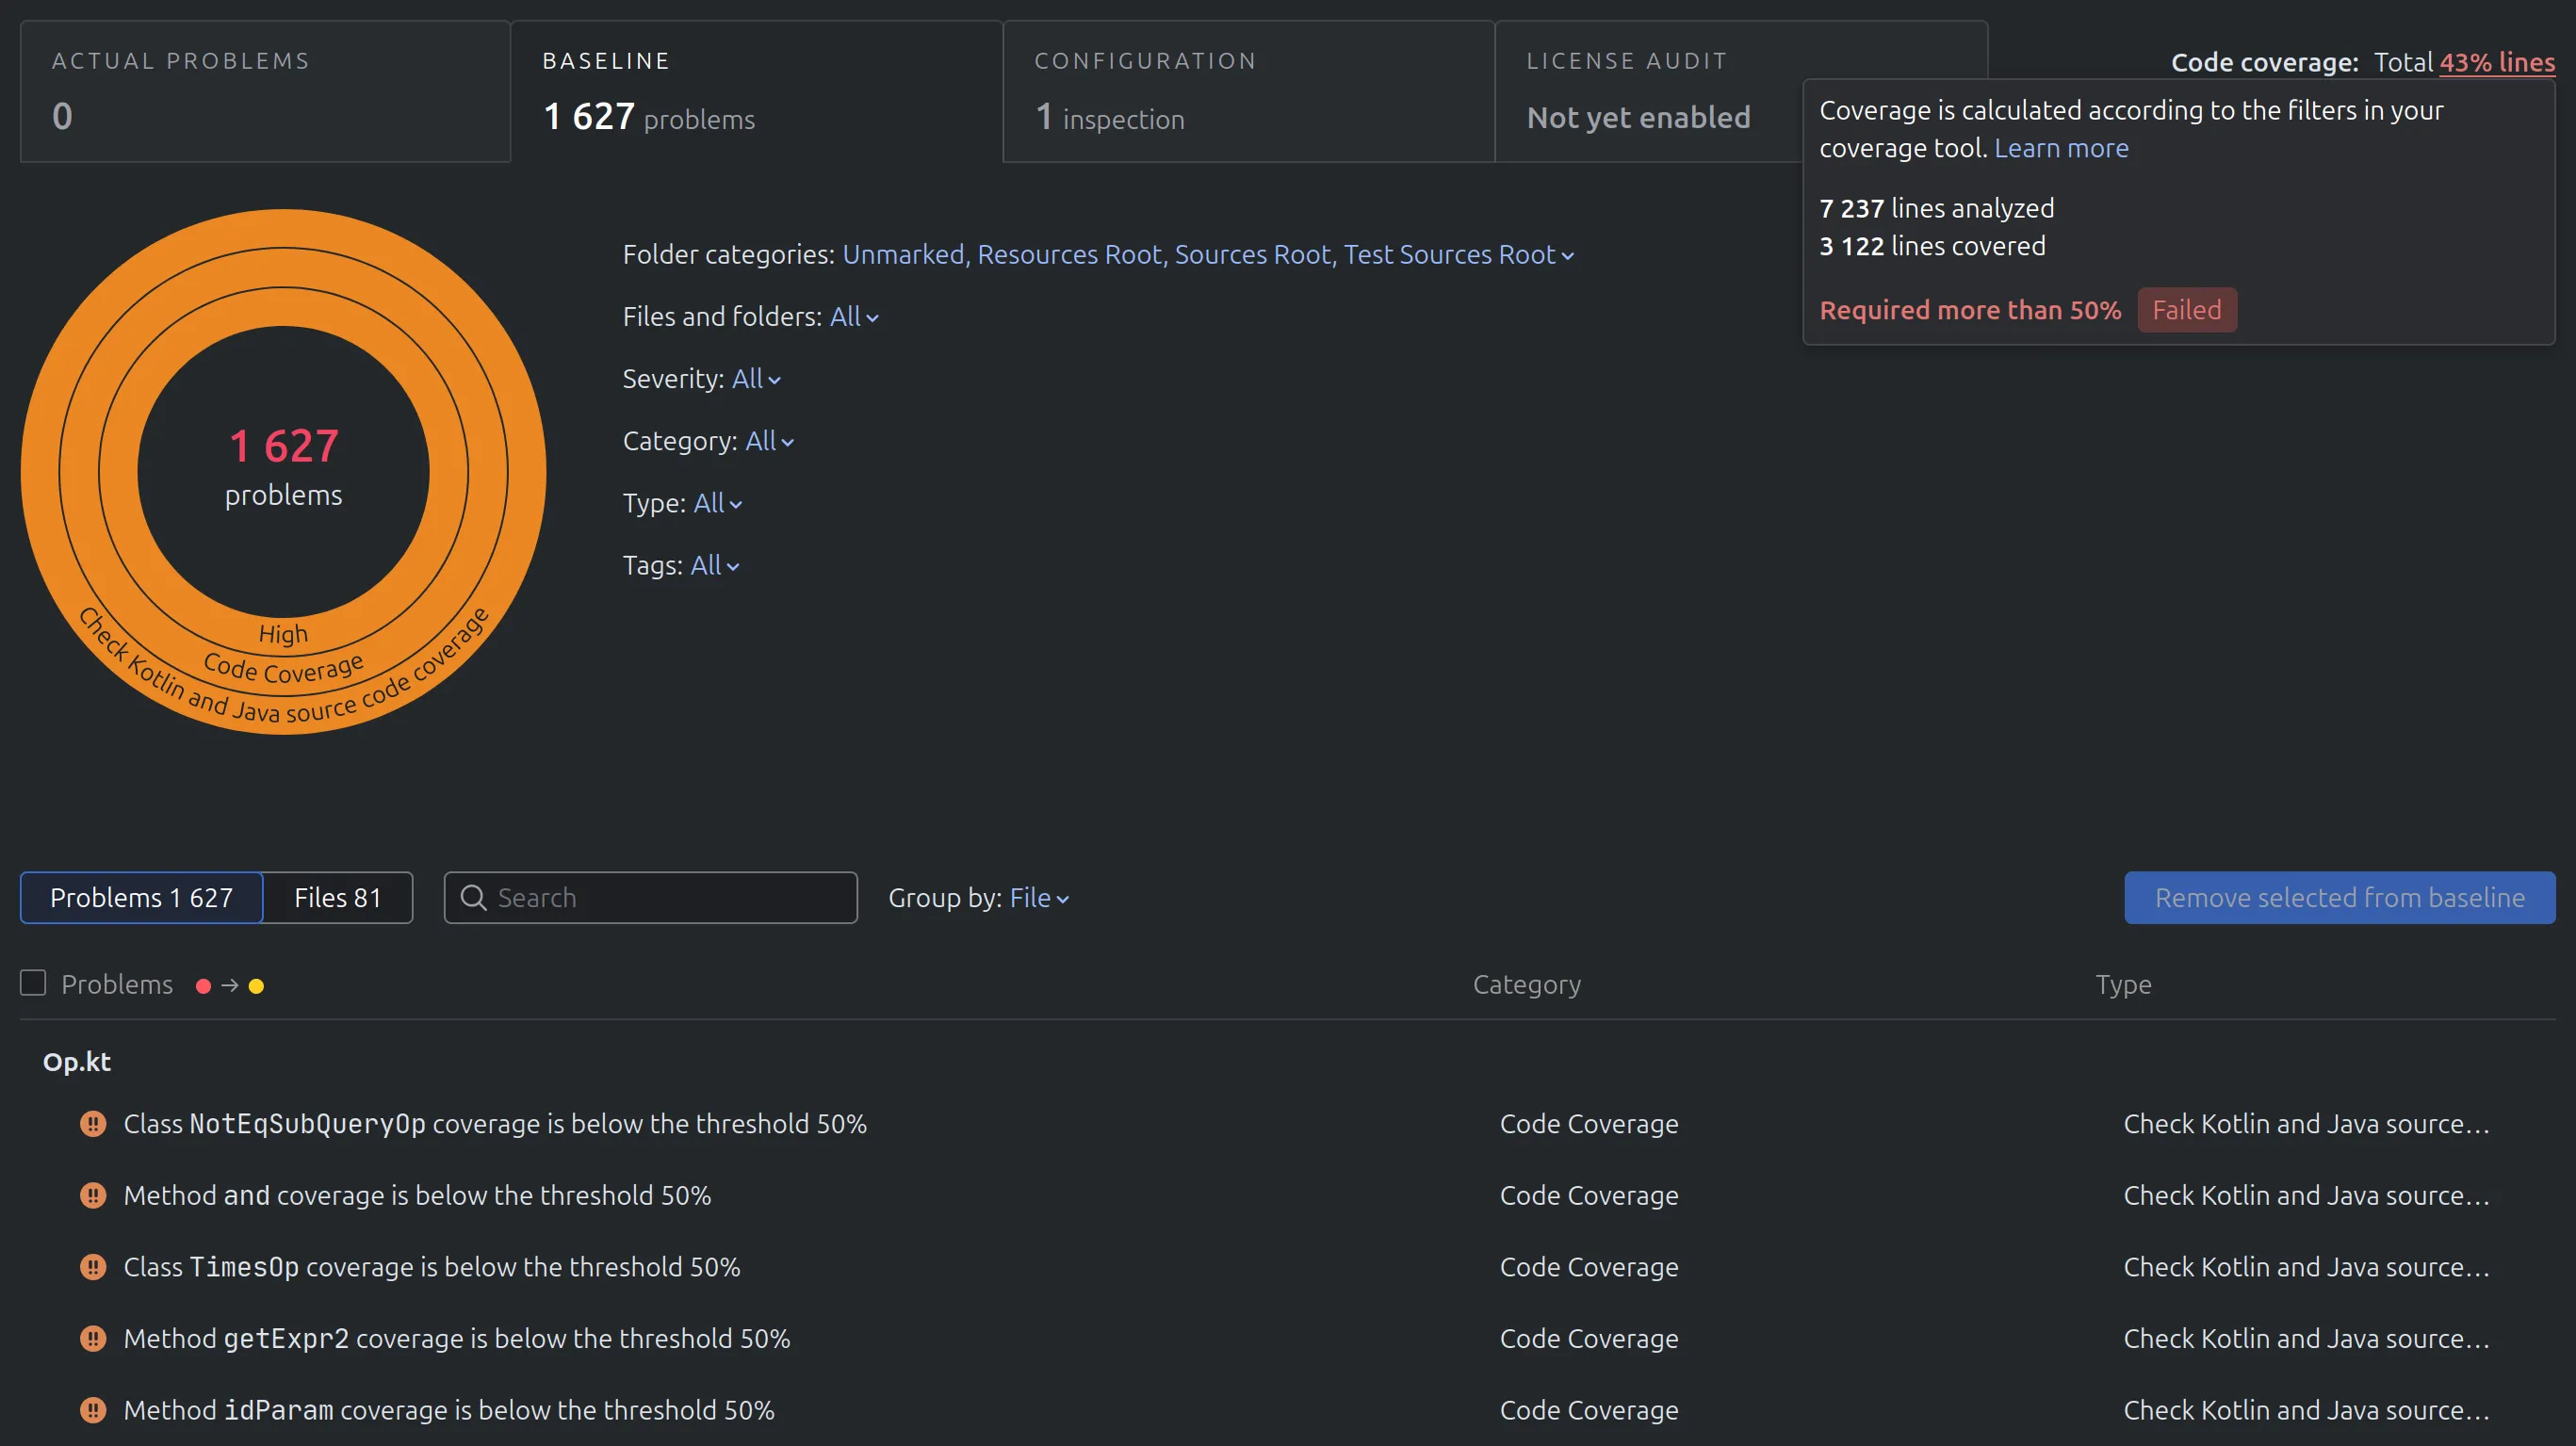
JetBrains’ Qodana platform facilitates this integration by offering centralized code coverage statistics within its Qodana report UI. After instrumenting a project and running coverage, teams can view these statistics in Qodana Cloud. The platform highlights coverage percentages and integrates relevant inspection results, providing a unified dashboard for code quality. This allows teams to track coverage trends, identify areas needing attention, and correlate coverage gaps with other quality issues flagged by static analysis.
IDE Integration
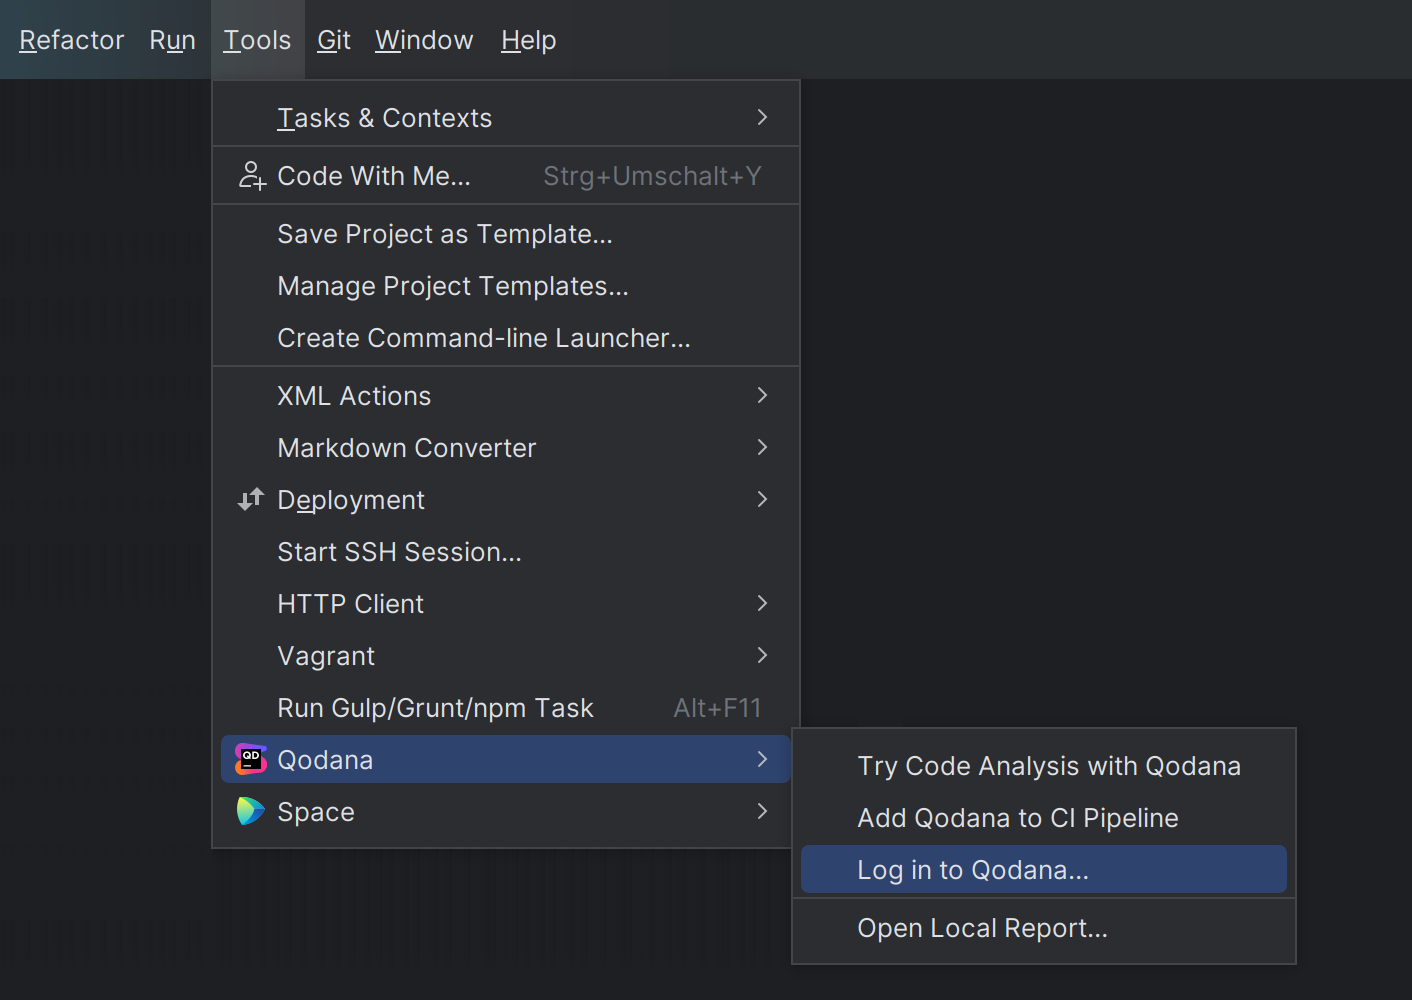
Developers can also view detailed code coverage reports directly within their JetBrains IDEs (IntelliJ IDEA, WebStorm, PhpStorm, PyCharm, GoLand). This "shift-left" approach allows developers to access coverage data in their familiar development environment, whether the reports are pulled from Qodana Cloud or generated locally.
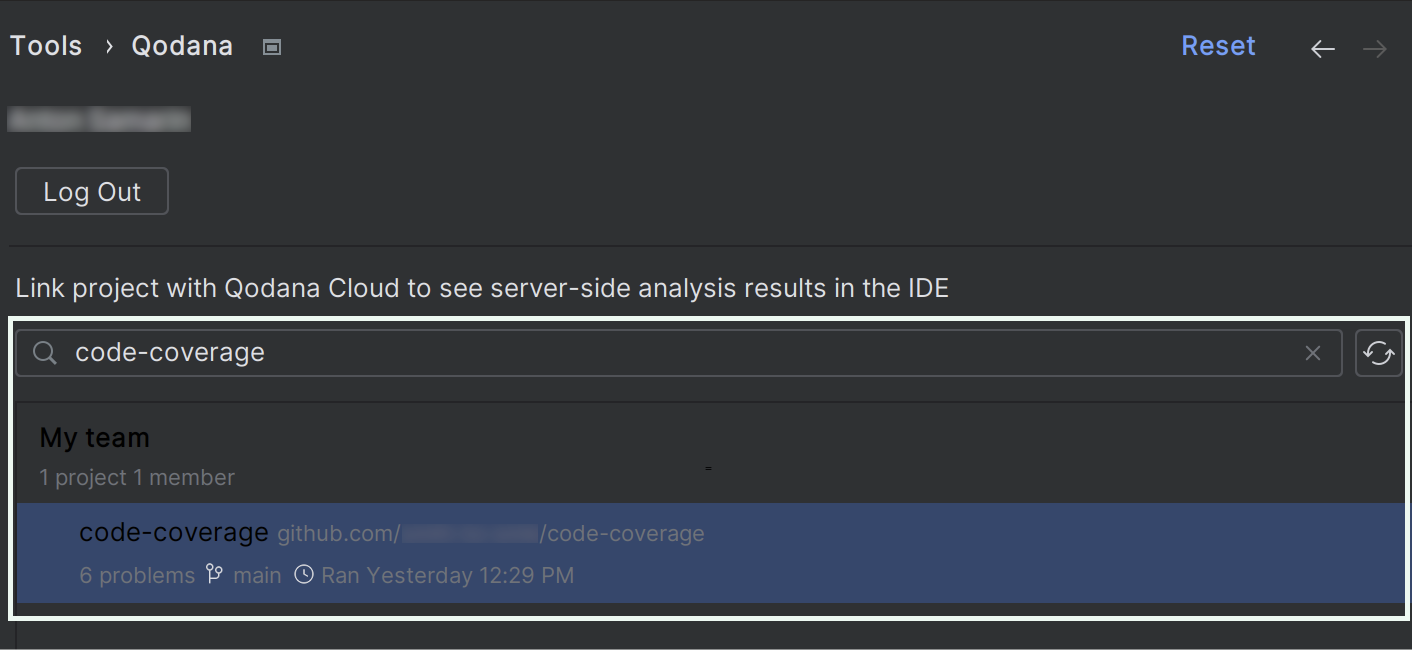
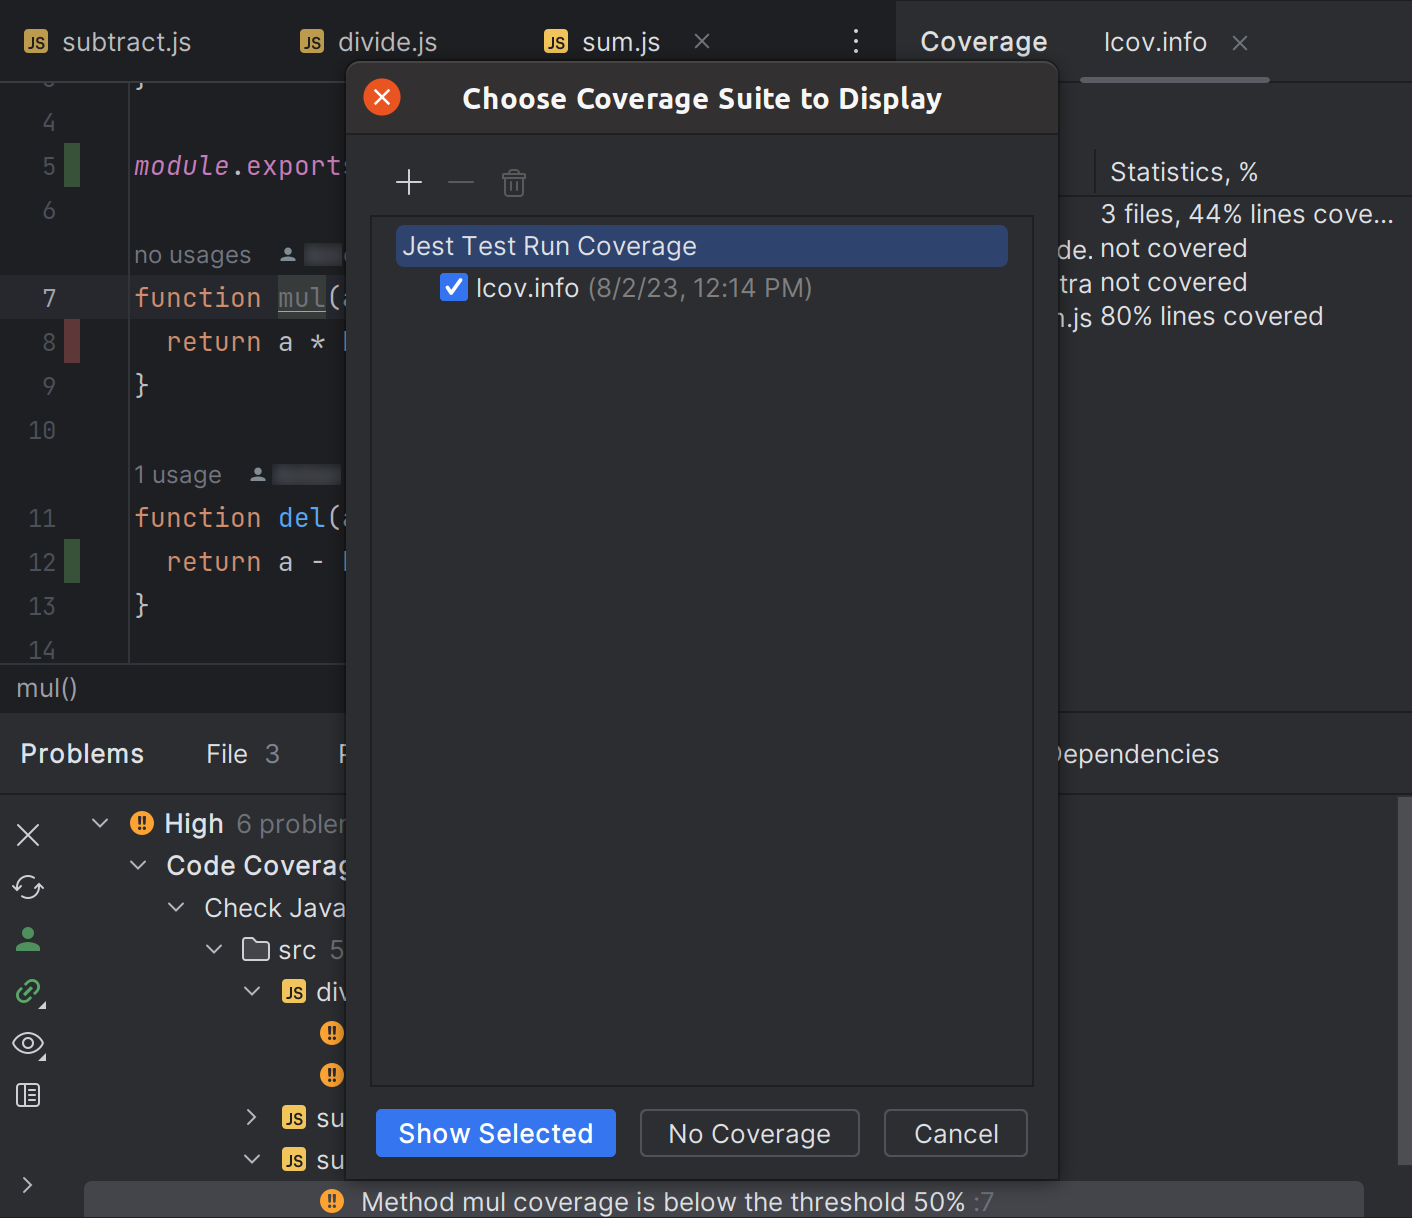
- Opening Reports: IDEs allow developers to open coverage reports from Qodana Cloud after linking or load reports from local storage.
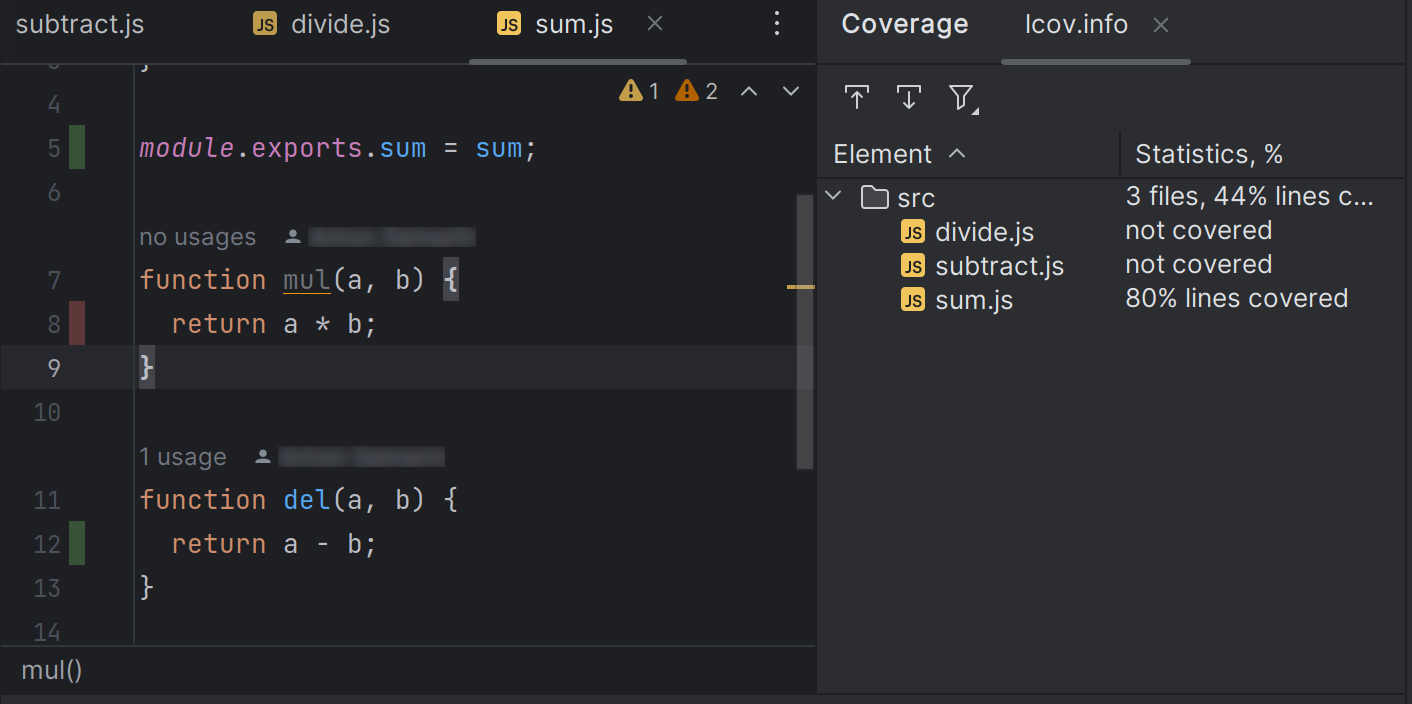
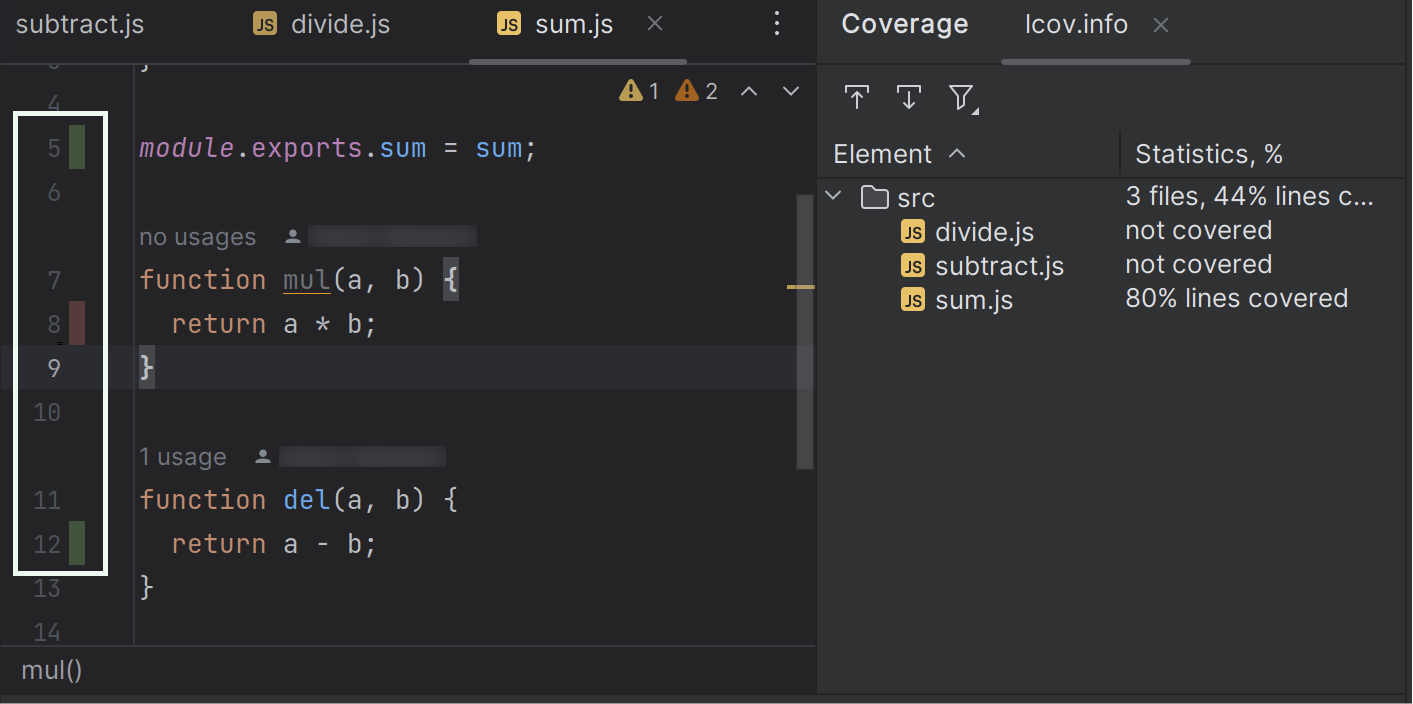
- Visualizing Coverage: The IDE’s "Coverage" tool window presents the test coverage report, displaying percentages and offering a detailed breakdown.
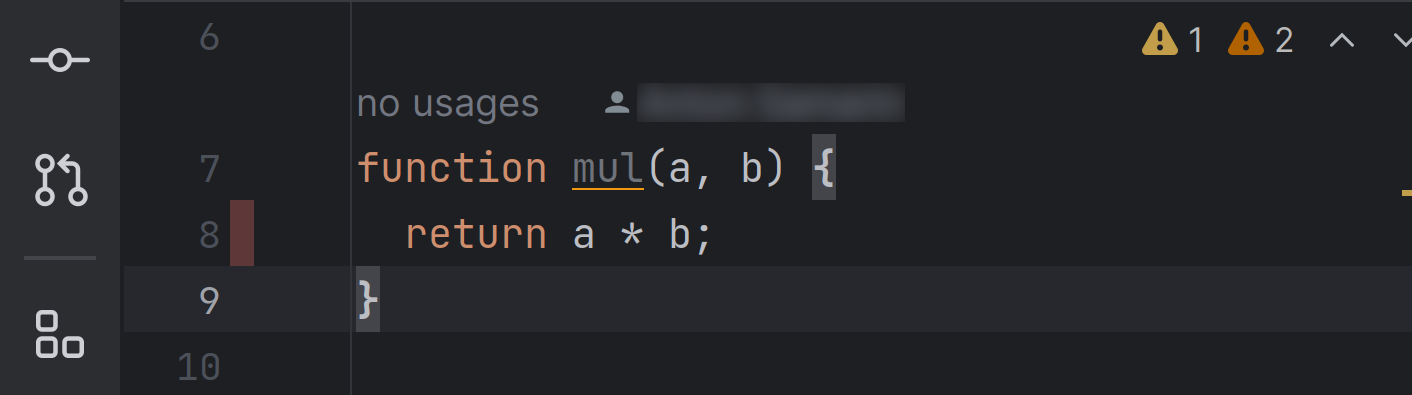
- In-Editor Highlighting: A key feature is the IDE’s ability to highlight the codebase with color marking. Typically, green signifies a covered line, while red indicates an uncovered line. This visual feedback is immediate and intuitive, allowing developers to quickly pinpoint precisely which parts of their code are missed by tests. The report intelligently distinguishes between executable logic and non-executable declarations, ensuring that coverage is only reported for relevant code.
This tight integration means that if code coverage results appear incomplete or inaccurate, developers can quickly reconfigure their coverage tool and regenerate a new report, receiving immediate feedback without leaving their IDE. Qodana also consolidates this information into an Insights Dashboard, offering a higher-level overview for project managers and team leads.
Navigating Common Pitfalls and Misconceptions About High Code Coverage
While code coverage is a valuable metric, a high percentage can sometimes provide a false sense of security, masking deeper issues in test quality. Development teams must be aware of common pitfalls:
- Weak or Missing Assertions: A test might execute 100% of a function’s lines but fail to assert any meaningful outcomes. If the test merely calls the function without validating its return value or side effects, critical bugs can still slip through undetected. Execution alone is not validation.
- Testing Implementation, Not Behavior: Tests that are too tightly coupled to the internal implementation details of a function can become brittle and require frequent updates even when the external behavior remains unchanged. This leads to maintenance overhead and can discourage refactoring.
- Untestable Code: Code that is highly coupled, relies heavily on global state, or has complex dependencies is inherently difficult to test in isolation. Forcing high coverage on such code can lead to overly complex tests that are hard to understand and maintain, or tests that mock too much, losing their value.
- Chasing Numbers for the Sake of It: Setting arbitrary 100% coverage targets can lead to developers writing trivial, low-value tests purely to satisfy the metric. These "tests" add no real value, bloat the test suite, and consume maintenance resources without improving quality.
- Ignoring Integration/System-Level Gaps: High unit test coverage doesn’t guarantee that different components integrate correctly or that the system meets end-to-end requirements. Coverage metrics primarily focus on individual units, potentially overlooking flaws in how these units interact.
- Contextual Blindness: Interpreting coverage without considering the nature of the code (e.g., UI code vs. business logic, error handling vs. happy path) can lead to misprioritization. Not all code needs or benefits from 100% coverage.
As highlighted by Microsoft Research, the correlation between high coverage and fewer post-release defects is not always straightforward at a granular level. This reinforces that coverage is a necessary, but not sufficient, condition for high-quality software. It must be complemented by other quality indicators, including defect trends, thorough incident post-mortems, static analysis warnings, and robust production monitoring.
Industry Perspectives and Future Outlook
Leading software engineering teams consistently emphasize a balanced approach to code coverage. Industry experts often state that the goal should be "effective coverage," meaning tests are written strategically to validate critical functionality and reduce risk, rather than simply achieving a high numerical percentage. The trend is towards smarter, more targeted testing driven by risk analysis and business impact.
The future of code coverage is likely to involve more sophisticated tools that leverage AI and machine learning to suggest optimal test cases, identify critical uncovered paths, and even generate tests automatically. Integration with advanced static analysis and dynamic analysis tools will become even tighter, providing developers with intelligent insights into potential vulnerabilities and test gaps.
Ultimately, code coverage remains a vital tool in the modern developer’s arsenal. When used thoughtfully and integrated effectively into CI/CD pipelines and alongside other quality metrics, it provides invaluable feedback that guides testing efforts, enhances code quality, and contributes significantly to the delivery of reliable and robust software systems.
Frequently Asked Questions (FAQ)
Is 100% code coverage ever required in real projects?
Yes, in specific safety-critical domains, 100% or near-100% coverage (including statement, branch, and MC/DC coverage) can be mandated. For instance, aerospace software compliant with DO-178C and automotive systems adhering to ISO 26262 often require such rigorous testing levels, tied to safety integrity levels. For most commercial web and mobile applications, however, 80% coverage for core modules is generally considered a strong goal, with diminishing returns for chasing 100% across the entire codebase. Test quality and a risk-based focus are more important than an absolute numerical target.
How often should I run coverage analysis in my project?
For active repositories, coverage analysis should ideally be run on every pull request or code commit. This ensures that any regressions in coverage are caught immediately, providing developers with instant feedback. For larger software projects with longer-running integration or end-to-end tests, a nightly or weekly full-coverage job is often appropriate. The trend data generated from these regular runs is crucial for guiding refactoring investments and identifying where additional testing efforts are most needed.
Which coverage metric should I prioritize first: line, branch, or something else?
Begin by prioritizing line coverage as a fundamental baseline. It’s easy to understand, implement, and communicate to stakeholders. Once your team is comfortable with line coverage, introduce branch coverage as the primary metric for non-trivial business logic. Branch coverage offers a more robust assessment of decision logic. More advanced metrics like Condition Coverage and Path Coverage are typically most beneficial for particularly complex or risk-heavy code segments, such as authorization checks, pricing engines, or programs with deep control structures, and can be adopted selectively rather than project-wide.
How do static code analysis and code coverage complement each other?
Static code analysis identifies potential problems in source code without executing it, flagging issues like dead code, null dereferences, security vulnerabilities, and style violations. Code coverage, conversely, shows which parts of the source code are actually exercised by tests during execution. Together, they create a powerful feedback loop: static analysis highlights complex or risky areas, while coverage reports reveal whether these areas are adequately tested. This combined insight allows developers to prioritize new tests or refactoring efforts effectively, leading to more resilient code.
Can I use code coverage for manual tests or only for automated tests?
While coverage tools are designed primarily for automated tests, they can also collect data when manual exploratory tests are run against an instrumented application. This is particularly useful during pre-release hardening phases to confirm which functionalities were manually exercised. The most valuable scenarios identified during manual testing can then be converted into automated tests to ensure sustained coverage over time across software projects.
Note: While examples in this article use specific coverage tools, JetBrains’ Qodana platform is designed to be tool-agnostic, supporting any tool that produces a compatible coverage report format.