AWS DevOps Agent Expands Autonomous Incident Resolution Capabilities with Model Context Protocol Extensibility
The AWS DevOps Agent is significantly enhancing its capabilities, moving beyond native integrations to autonomously investigate an expanding range of production incidents. This marks a pivotal advancement in cloud operations, empowering the agent to diagnose complex failures like CrashLoopBackOff, meticulously trace ConfigMap deletions through audit logs, and intricately correlate Amazon CloudWatch metrics with cluster events – all without requiring human intervention. This leap towards self-governing incident response promises to drastically reduce mean time to resolution (MTTR) and free up valuable engineering resources.
The Evolving Landscape of Cloud Operations and the Need for Autonomy
Modern cloud environments, characterized by distributed microservices, ephemeral containers, and dynamic infrastructure, present unprecedented challenges for operational teams. The sheer volume of telemetry data – logs, metrics, traces – generated by these systems can quickly overwhelm human operators, making rapid incident diagnosis and resolution a formidable task. A single application might span dozens of services, hundreds of containers, and multiple infrastructure layers, each contributing to a complex web of potential failure points. Industry reports consistently highlight that slow incident response directly impacts business continuity, customer satisfaction, and ultimately, revenue. The average MTTR for critical incidents often stretches into hours, costing organizations millions annually in lost productivity and reputational damage. This increasing complexity necessitates a paradigm shift towards intelligent, automated incident investigation.
AWS DevOps Agent: A Foundation for Autonomous Incident Response
At its core, AWS DevOps Agent is designed to be a vigilant and intelligent assistant for cloud operations. It integrates deeply with AWS services and Kubernetes environments to provide a foundational layer for autonomous troubleshooting. Its initial strengths lie in its ability to understand the state of Kubernetes pods, parse container logs, query rich data from CloudWatch Container Insights, and correlate events across the cluster. This native visibility is invaluable for tackling common issues such as application crashes, resource exhaustion at the container level, and configuration drifts within the Kubernetes plane. However, the intricate nature of cloud infrastructure means that critical diagnostic data often resides outside the agent’s immediate purview.

Bridging the Visibility Gap: The Model Context Protocol (MCP)
Despite its powerful native integrations, the AWS DevOps Agent, like any specialized tool, encounters a visibility boundary. When the crucial data required for root cause analysis resides outside its pre-defined integrations—perhaps deep within a node’s operating system, embedded in a third-party monitoring tool, or hidden behind a database’s internal diagnostics—the agent reaches an impasse. It can accurately describe symptoms, but it lacks the direct access to the underlying evidence necessary to pinpoint the definitive root cause. This limitation often necessitates manual intervention, requiring engineers to SSH into nodes, query external systems, or consult proprietary dashboards, thereby negating the benefits of autonomous operation.
This is precisely where the Model Context Protocol (MCP) emerges as a game-changer. MCP is an open standard specifically designed to enable AI agents to discover and invoke external tools in a structured, secure, and standardized manner. By supporting custom MCP servers, AWS DevOps Agent can now extend its diagnostic reach without requiring modifications to the agent itself. This extensible framework allows organizations to expose new capabilities and data sources to the agent, integrating it seamlessly into their unique operational landscapes.
The extensibility model, grounded in robust design principles, follows a clear three-step process:
- Identify the Data Source: Pinpoint the specific data that AWS DevOps Agent cannot natively access but is critical for comprehensive incident investigation.
- Build an MCP Server: Develop an MCP server that acts as a secure, structured wrapper around this external data source. This server translates agent requests into calls understandable by the external system and formats the responses for the agent.
- Connect to AWS DevOps Agent: Integrate the newly built MCP server with AWS DevOps Agent, allowing the agent to automatically discover and incorporate these new tools into its investigation workflows.
This architecture is underpinned by three critical design principles:
- Structured Data, Not Raw Text: The MCP server must return structured data, pre-indexed with severity levels and stable IDs. This allows the agent to efficiently filter, reference, and correlate findings, rather than sifting through unstructured log dumps.
- No Direct Shell Access: Crucially, the agent is never granted a direct shell on any system. Interactions are mediated through a controlled, auditable execution model, such as AWS Systems Manager (SSM) Automation, ensuring security and compliance.
- Composable Tools: Tools should be designed such that their outputs can serve as inputs to other tools, creating a logical chain of evidence that the agent can follow to progressively narrow down the root cause.
Deep Dive into EKS Node Diagnostics: A Critical Use Case

While AWS DevOps Agent integrates effectively with Amazon EKS for inspecting pod status, container logs, and CloudWatch metrics, a significant class of EKS production issues originates at a layer these tools cannot natively reach: the node operating system. This layer holds a treasure trove of diagnostic artifacts crucial for complex troubleshooting. These include:
- Network Configuration: iptables rules, full CNI (Container Network Interface) configuration and IPAMD (IP Address Management Daemon) state, route tables, conntrack entries. These are vital for diagnosing IP allocation failures, DNS resolution issues, and network policy enforcement problems.
- Kernel and Runtime Logs: dmesg kernel messages, containerd runtime logs, kubelet journal. These provide insights into storage mount timeouts, node registration failures, and underlying system stability.
- System Parameters: sysctl parameters, ENI (Elastic Network Interface) metadata. These can reveal performance bottlenecks or misconfigurations at the OS level.
These artifacts exist exclusively on the node, making manual SSH sessions the traditional, time-consuming, and error-prone method of investigation. The inability to autonomously access this data represents a significant blind spot for the DevOps Agent.
Architecting Extensibility: How the MCP Server Works
To address this critical gap, the sample-eks-node-diagnostics-mcp repository offers a concrete example of an MCP server designed to provide AWS DevOps Agent with structured access to node-level diagnostic data. This solution leverages AWS Systems Manager (SSM) Automation, renowned for its safe and auditable execution capabilities, as the backbone for data collection.
Figure 1: End-to-end architecture of the EKS Node Diagnostics MCP server. (Referencing the provided image description)
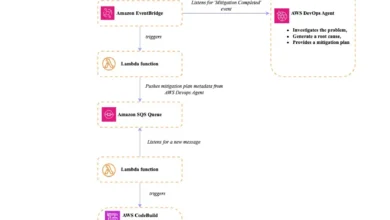
The architecture diagram illustrates a sophisticated workflow:
- AWS DevOps Agent: Initiates an investigation and, through its integration with the MCP server, discovers and invokes diagnostic tools.
- Amazon Bedrock AgentCore Gateway: Serves as the secure entry point. It receives tool invocation requests from the AWS DevOps Agent over MCP/HTTPS.
- Authentication (Amazon Cognito OAuth 2.0): AgentCore Gateway authenticates incoming requests using Amazon Cognito, ensuring that only authorized clients with valid OAuth 2.0 tokens can invoke tools.
- Lambda-based Tool Router: After successful authentication, AgentCore Gateway routes the tool calls to a Lambda function, which acts as the Tool Router. This Lambda function understands the specific diagnostic tool requested.
- SSM Automation: The Tool Router Lambda function triggers an AWS Systems Manager (SSM) Automation runbook. SSM Automation is a powerful capability that allows for secure and automated execution of operational tasks across AWS resources.
- EKS Worker Nodes (SSM Agent): The SSM Automation runbook is dispatched to the target EKS worker nodes, which must be running the SSM Agent. The SSM Agent executes the commands defined in the runbook to collect the requested diagnostic logs and data.
- S3 Bucket (KMS-encrypted): The collected log archives are securely uploaded to an Amazon S3 bucket, which is encrypted using AWS Key Management Service (KMS) for data at rest.
- S3 Event Trigger (Lambda Function): An S3 event notification triggers another Lambda function.
- Extraction and Indexing: This Lambda function processes the uploaded log archives, extracts relevant findings, and indexes them. This indexing is crucial for presenting structured data back to the AWS DevOps Agent.
- Agent Query: Finally, the AWS DevOps Agent queries these indexed findings to incorporate them into its ongoing investigation.
This server exposes a comprehensive suite of tools, including log collection, pre-indexed error retrieval, cross-file search and correlation, structured network diagnostics, and even live packet capture. A typical agent workflow would chain these tools together: collect -> status -> errors -> search -> correlate -> read -> summarize, with each step producing structured outputs that feed into the subsequent analysis, building a coherent chain of evidence. The critical aspect here is that the AWS DevOps Agent never obtains a direct shell on the node; every interaction is meticulously mediated by SSM Automation, ensuring an auditable, IAM-controlled, and non-interactive execution model.

Connecting Through Amazon Bedrock AgentCore Gateway
The reference implementation wisely utilizes Amazon Bedrock AgentCore Gateway to expose the Lambda-backed MCP server to AWS DevOps Agent. AgentCore Gateway simplifies this integration by automatically converting Lambda functions into MCP-compatible tools, managing authentication, handling protocol translation, and facilitating tool discovery through a single, unified managed endpoint.
The integration process involves three distinct steps:
- OAuth Authorizer with Amazon Cognito: A Cognito User Pool is provisioned, configured for the OAuth 2.0 client credentials flow. This establishes a robust security perimeter, ensuring that only clients with valid tokens can invoke tools via the gateway.
- Gateway Creation and Lambda Registration: The Lambda function responsible for tool invocations is registered as a target on the AgentCore Gateway. The gateway then automatically discovers the tool schemas from the Lambda and makes them accessible through the MCP protocol. The gateway’s endpoint becomes the single, canonical MCP URL for the AWS DevOps Agent.
- AWS DevOps Agent Connection: The MCP server is registered at the account level within the AWS DevOps Agent console, providing the gateway URL and OAuth configuration details. Specific tools are then allowlisted for each Agent Space as needed. For authentication, AWS DevOps Agent obtains a JSON Web Token (JWT) from the Cognito token endpoint using the client credentials grant and passes it as a Bearer token in all requests to the gateway URL.
A Real-World Scenario: Diagnosing a Subtle EKS Network Fault
To demonstrate the power of this extended visibility, consider a realistic node-level failure scenario on a test EKS cluster. The scenario involves a manually injected fault that blocks pod DNS resolution at the iptables level. This type of issue is particularly insidious because kubectl commands would show pods as "Running," masking the underlying problem. The applications would fail with DNS resolution errors, but no Kubernetes event or pod status would directly point to the cause. The iptables DROP rules, critical evidence, exist exclusively within the node’s firewall configuration—a layer inaccessible via standard Kubernetes API calls.
Setting Up the Scenario:
An EKS cluster with a managed node group (SSM Agent running by default on Amazon EKS optimized AMIs) is used. A sample web-frontend deployment is applied to a demo-app namespace, with 3 replicas. The node and instance ID where these pods are running are identified.

Injecting the Fault (with a critical warning):
WARNING: The following commands will disrupt DNS resolution for all pods on the target node. These should ONLY be run in a non-production test environment. Do NOT execute on production nodes.
Using SSM Session Manager, specific iptables rules are inserted into the FORWARD chain, blocking UDP and TCP traffic to the kube-dns ClusterIP on port 53. This simulates a networking issue where pods run but cannot resolve DNS, with the root cause hidden in the node’s firewall.
Investigating with AWS DevOps Agent:
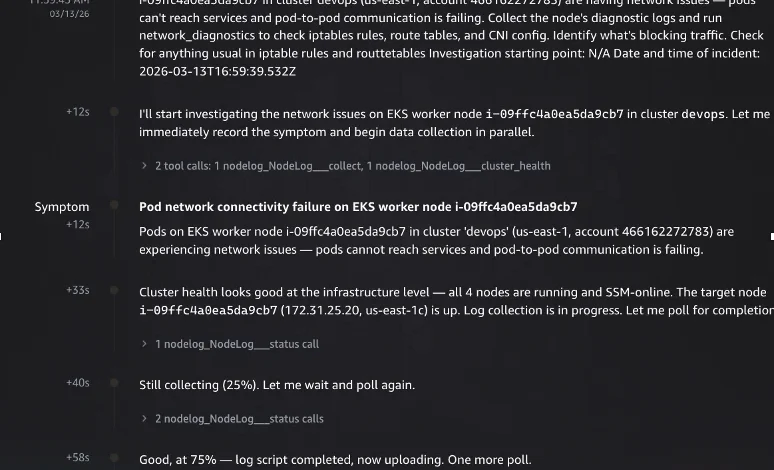
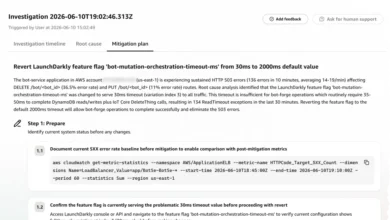
An engineer observes applications reporting DNS failures and initiates an investigation with AWS DevOps Agent: "Pods on node i-xxxxxxxxxx in cluster EKS-sample (us-east-1) are running but applications report DNS resolution failures. Collect the node logs and investigate." (Figure 2: Starting an investigation in AWS DevOps Agent, with symptom description and incident timestamp.)
The agent’s investigation unfolds chronologically and strategically:
-
Initial Data Collection: The agent records the symptom and concurrently launches two actions: collecting node logs via the
nodelog_collecttool (provided by the MCP server) and checking overall cluster health. The cluster health check quickly confirms all nodes are running and SSM-online. -
Log Collection and Parallel Workstreams: The agent polls the log collection status, tracking progress. Upon completion, it intelligently fans out into multiple parallel workstreams (Figure 3: Investigation timeline showing the initial data collection phase). These include:
- Network Diagnostics: Deep-diving into iptables and routing.
- Quick Triage: Scanning collected logs for common error patterns.
- Healthy Node Comparison: Collecting identical diagnostics from a known-good node for comparative analysis.
-
Concurrent Deep-Dive Tasks: The agent orchestrates four parallel investigation tasks to maximize coverage and minimize the time to root cause (Figure 4: Parallel investigation phase):

deep-dive-iptables-routes: Analyzes firewall rules and routing tables (8 tool calls, 1 minute 44 seconds).search-network-errors: Scans logs for network-related error patterns (15 tool calls, 7 minutes 51 seconds).collect-healthy-node: Gathers diagnostics from a healthy node for baseline comparison (13 tool calls, 4 minutes 55 seconds).check-oom-and-pod-status: Investigates kernel OOM (Out Of Memory) kills and pod health (19 tool calls, 8 minutes 12 seconds).
Each task generates a structured report, feeding into the final synthesis.
-
Root Cause Identification: The
deep-dive-iptables-routestask proves definitive. The agent identifies two CRITICAL findings: a "FAULT-INJECT-DROP-POD-TO-POD" rule and a "FAULT-INJECT-DROP-SERVICE-CIDR" rule, both in theFORWARDchain, explicitly dropping inter-pod and service CIDR traffic, respectively. It also flags a MEDIUM-severity finding: a blackhole route for the Kubernetes service CIDR that is absent on healthy nodes. Other checks (kube-proxy chains, VPC CNI, routing) appear normal. This severity classification allows the agent to immediately hone in on the critical issues (Figure 5: Deep-dive findings from the iptables and route table analysis). -
Diagnosis Confirmation: The healthy node comparison solidifies the diagnosis. The agent contrasts seven dimensions between the unhealthy and a known-good node. Key differences emerge: the blackhole route exists only on the unhealthy node, kubelet API server timeout errors are exclusive to the unhealthy node, conntrack entries are 12 times higher (1,962 vs. 169), and IPAMD reconciliation errors are 5 times more frequent. Crucially, iptables
FORWARDchain counters show 2.4 billion packets processed on the unhealthy node versus zero on a freshly started healthy node, confirming sustained traffic disruption (Figure 6: Healthy node comparison confirming the diagnosis). -
Definitive Root Cause Determination: The agent synthesizes all findings into a clear root cause: "Fault-injection workloads on node i-09ffc4a0ea5da9cb7 causing multi-vector network disruption." It precisely identifies three modifications introduced by a chaos experiment namespace on the target node: two specific iptables
DROPrules in theFORWARDchain, and a blackhole route for the Kubernetes service CIDR. These modifications collectively create a multi-vector network disruption, explaining why pods appear "Running" but are unable to communicate or reach Kubernetes services, includingkube-dns(Figure 7: Root cause determination).
This entire investigation, which would typically involve hours of manual effort, SSH sessions, and expert knowledge, is completed autonomously by the AWS DevOps Agent, providing a precise, actionable diagnosis within minutes.
Broader Implications and Future Directions
The EKS node diagnostics use case is a powerful demonstration, but the underlying architectural pattern is broadly applicable. It generalizes to any system where the SSM Agent is running and where data collection can be orchestrated via an SSM Automation runbook. This includes:

- EC2 Instances: Collecting OS-level logs, network configuration, package state, or application diagnostics on standard EC2 instances.
- ECS Container Instances: Gathering Docker daemon logs, ECS agent state, or iptables configurations from container hosts.
- On-Premises Servers: Extending visibility to hybrid cloud environments by integrating with servers registered via SSM Hybrid Activations.
- Managed Fleets: Applying the same diagnostic capabilities across entire fleets of managed nodes.
Furthermore, the pattern extends beyond SSM-managed hosts. The core idea is to wrap inaccessible data sources with an MCP server. This could involve:
- Network Devices: Reaching management planes through API calls.
- Databases: Executing read-only diagnostic queries.
- Third-Party APM Tools: Integrating via vendor-specific API integrations.
In each instance, the consistent three-step approach remains: identify the unreachable data, build a secure MCP server for structured access, and connect it to AWS DevOps Agent. This approach signifies a move towards a truly unified operational intelligence platform.
Strategic Advantages for DevOps Teams
This extensibility offers significant strategic advantages for DevOps and SRE teams:
- Reduced MTTR: By automating the collection and analysis of previously inaccessible diagnostic data, the time taken to identify and resolve incidents is drastically cut. This directly translates to reduced downtime and improved service availability.
- Enhanced Operational Efficiency: Engineers are freed from tedious, repetitive manual troubleshooting tasks, allowing them to focus on higher-value activities like preventative measures, system design, and innovation.
- Democratization of Expertise: The agent, armed with custom tools, can perform advanced diagnostics that might otherwise require specialized knowledge or access, making sophisticated troubleshooting more accessible to a broader team.
- Proactive Problem Solving: While primarily reactive, faster incident resolution feeds into a cycle of learning and proactive improvement, as patterns identified by the agent can inform future architectural decisions or automated remediations.
- Auditable and Secure Operations: The reliance on SSM Automation and AgentCore Gateway ensures that all diagnostic actions are auditable and adhere to strict IAM controls, enhancing security posture and compliance.
Implementation Considerations and Best Practices
While powerful, this approach is not a panacea. It complements, rather than replaces, other operational tools:

- Continuous Monitoring: It is not a substitute for continuous monitoring solutions like CloudWatch Container Insights or Prometheus for real-time alerting and metrics collection.
- Log Shipping: Organizations with strict compliance requirements for continuous log retention should continue using dedicated log shipping solutions.
- Native Integrations: Where AWS DevOps Agent already has native access to a data source, native integrations remain the preferred and most efficient method.
Prerequisites for the reference implementation include SSM Agent running on target nodes with appropriate IAM permissions. It’s crucial to treat the provided sample as a proof of concept and thoroughly validate it in non-production environments before deployment with production workloads. Cost considerations for AWS Lambda, Amazon S3, AWS KMS, Amazon Cognito, and Amazon Bedrock AgentCore Gateway should also be factored in, with costs varying based on usage. It is recommended to delete the stack when not in use during evaluation.
Conclusion
The introduction of Model Context Protocol (MCP) as a standardized extensibility mechanism represents a significant leap forward for AWS DevOps Agent. It empowers organizations to bridge critical visibility gaps without modifying the agent itself, fostering a more comprehensive and autonomous approach to incident response. The pattern is elegant and robust: identify the unreachable data source, construct an MCP server to encapsulate safe and structured access to it, and integrate it with AWS DevOps Agent via Amazon Bedrock AgentCore Gateway. The agent takes on the complex reasoning and correlation, while the MCP server diligently handles the secure, structured data access.
To embark on this journey towards enhanced autonomous incident resolution:
- Explore the
sample-eks-node-diagnostics-mcprepository for a practical reference implementation. - Identify specific data sources within your own environment that currently pose visibility challenges for automated diagnosis.
- Begin designing custom MCP servers to securely expose these critical insights to AWS DevOps Agent, transforming your operational capabilities.


