Mastering Go’s Escape Analysis: Unraveling Compiler Optimizations for Peak Performance

Go, the programming language developed at Google, has earned widespread acclaim for its simplicity, powerful concurrency model, and developer-friendly approach to memory management. A cornerstone of this design philosophy is the abstraction of intricate memory operations, such as escape analysis and garbage collection, allowing developers to concentrate on code functionality rather than low-level system details. This automatic handling of memory is often lauded as one of Go’s most compelling features, streamlining development and bolstering application stability. However, this inherent "mysticism" of the Go compiler can present a significant challenge when performance bottlenecks emerge, particularly those related to memory allocation. When a program’s efficiency falters due to unseen memory issues, the need to demystify these automatic processes becomes paramount for optimization.
This article delves into one of the most critical and often perplexing performance optimization aspects in Go: escape analysis. We will explore how the Go compiler judiciously decides whether a value resides on the stack—a fast, temporary memory region—or is "escaped" to the heap—a shared, longer-lived space managed by the garbage collector. Understanding this process is not merely an academic exercise; it is a fundamental skill for Go developers aiming to write highly performant and resource-efficient applications. We will cover the mechanics of escape analysis, identify common scenarios that trigger heap allocations, explain the difficulties associated with inspecting compiler output manually, and introduce how integrated development environments (IDEs) like GoLand are now simplifying this complex diagnostic task.
The Foundation: Go’s Memory Management Philosophy
Google engineered Go to be a language that excels in modern computing environments, particularly for building scalable network services and robust systems. A key aspect of achieving this vision was to reduce the cognitive load on developers concerning memory management, a common source of bugs and performance issues in languages like C or C++. Go’s approach leverages an efficient garbage collector (GC) and a sophisticated compiler that automatically manages where data is stored.
Stack vs. Heap: A Critical Distinction
At the heart of Go’s memory management lies the distinction between the stack and the heap.
- The Stack: This is a Last-In, First-Out (LIFO) region of memory allocated per goroutine. Stack allocations are incredibly fast, typically involving a simple pointer increment or decrement. Values stored on the stack are automatically deallocated when the function that created them returns, making memory reclamation instantaneous and free of overhead. This makes the stack ideal for short-lived, local variables.
- The Heap: This is a shared, dynamic memory region accessible by all goroutines. Heap allocations are more resource-intensive, requiring coordination, potentially involving mutexes, and are subject to garbage collection. The garbage collector periodically scans the heap to identify and reclaim memory that is no longer referenced, incurring CPU cycles and potentially introducing latency spikes. The heap is necessary for values that must persist beyond the lifetime of the function that created them.
The Go compiler’s escape analysis is the gatekeeper between these two memory realms. Its primary goal is to keep as many values on the stack as possible to maximize performance by minimizing GC pressure and allocation overhead.
Decoding Escape Analysis: How the Compiler Makes Decisions
Escape analysis is a sophisticated compiler optimization that scrutinizes every value created by a program to determine its safe memory location. The fundamental question the compiler seeks to answer for each value is: "Can this value safely live on the stack, or does something outside the current function’s scope require access to it after the function returns, necessitating its allocation on the heap?"
A value is said to "escape" when the compiler cannot definitively prove that its usage will conclude by the time the function that created it exits. If any reference to a value can potentially outlive its creating function, the compiler conservatively allocates that value on the heap. A classic illustration is returning a pointer to a local variable. While the variable is defined within a function, the returned pointer allows external access after the function completes. Consequently, the value cannot reside on the function’s stack frame, which is slated for immediate discard. It must "escape" to the heap.

The Dynamic Nature of Escape Decisions
It is crucial to understand that escape analysis decisions are not static. They can fluctuate based on numerous factors, including:
- Code Structure: Minor refactorings can alter a value’s lifetime.
- Go Version: The Go compiler continuously evolves, with each new release often bringing improved optimization algorithms. For instance, Go versions 1.25 and 1.26 introduced significant allocation optimizations, causing values that previously escaped to now remain on the stack in certain contexts.
- Environment: The operating system (GOOS) and architecture (GOARCH) can influence compiler decisions.
- Compiler Settings and Flags: Debug flags, such as those that disable inlining or other optimizations, can dramatically change allocation outcomes.
- Inlining Decisions: If a function is inlined, its local variables might be treated differently in the context of the calling function, potentially avoiding an escape.
This dynamic nature underscores why developers cannot assume a value’s allocation behavior will remain constant across different builds or environments. Direct inspection is always necessary.
Why Understanding Escape Analysis is Indispensable
Unlike languages where developers manually control memory allocation (e.g., malloc/free in C), Go handles this automatically. The Go documentation even states that developers "don’t need to know" about stack or heap allocation. While this is true for basic functionality and memory safety (Go prevents dangling pointers or use-after-free errors regardless of allocation location), it becomes a critical blind spot for performance tuning.
While the compiler ensures correctness, developers retain agency to structure their code in ways that influence these compiler decisions. A deep understanding of escape analysis empowers developers to:
- Reduce Garbage Collection Pressure: Fewer heap allocations mean the GC runs less frequently, or with less work, leading to lower latency and higher throughput, especially in performance-critical applications.
- Improve Cache Locality: Stack allocations often result in better data locality, as related data tends to be stored close together in memory, leading to more efficient CPU cache utilization.
- Optimize Hot Paths: Identifying and mitigating unnecessary heap allocations in frequently executed code paths (hot paths) can yield substantial performance gains.
For any Go developer aspiring to optimize their applications beyond basic functionality, comprehending escape analysis is not optional; it is a fundamental skill.
Common Scenarios Triggering Heap Escapes
While every escape decision is context-dependent, a handful of recurring patterns frequently lead to values escaping to the heap. Recognizing these patterns helps developers interpret compiler output and decide whether an allocation requires optimization. It’s vital to remember that not every escape is problematic; complex programs will inherently utilize the heap. The goal is to identify unnecessary or avoidable escapes in performance-sensitive areas.
1. Returning Pointers to Local Variables
This is arguably the most prevalent reason for a value to escape. When a function creates a local variable and then returns a pointer to it, the compiler recognizes that the caller will hold a reference to this value long after the function’s stack frame is torn down.
func NewUser(name string) *User
    u := UserName: name // 'u' escapes to the heap
    return &u
In this example, &u ensures that the User struct u is moved to the heap, guaranteeing its availability to the caller. Go’s compiler makes this safe and automatic. Whether this is an "issue" depends entirely on the context. Returning pointers is often idiomatic for API design, readability, and avoiding expensive copies of large structs. Optimization is only warranted if profiling reveals this specific allocation contributes significantly to a performance bottleneck.

2. Variables Captured by Closures and Goroutines
When a closure or goroutine captures a variable, and there’s a possibility that the closure or goroutine might outlive the function that created it, the captured variable must escape to the heap. The compiler, being conservative, assumes the captured value will remain reachable indefinitely.
func process(data []byte)
    go func()
        handle(data) // 'data' may escape: the goroutine can outlive 'process'
    ()
Goroutines are a frequent source of such escapes because their asynchronous nature means they can continue executing long after their parent function has completed. The compiler errs on the side of safety, allocating any variable potentially touched by an outliving goroutine on the heap.
3. Passing Concrete Values Through Interfaces
When a concrete value is assigned to or passed as an interface type, it often leads to a heap allocation. This is because interfaces are dynamic; they need to store both the type and the value. This "boxing" operation can sometimes necessitate heap allocation, particularly when the concrete type is unknown at compile time or when the interface is part of a longer-lived structure. This frequently occurs in scenarios like logging, formatting (e.g., fmt.Println), and generic interface-based APIs.
func logValue(v int)
    fmt.Println(v) // 'v' is passed as an interface and may escape
However, it’s crucial to note that interface usage does not automatically guarantee a heap allocation. The Go compiler has become increasingly sophisticated over time, optimizing many interface calls to avoid escapes where possible. Developers should treat interface boundaries as areas to check for escapes, rather than to avoid entirely.
4. Values Stored in Long-Lived Data Structures
If a value (or a pointer to it) is stored within a data structure—such as a slice, map, or struct field—and that container itself outlives the current function, the stored value must also escape to the heap. Its lifetime is tied to the container’s lifetime.
type Cache struct
    items map[string]*Item


func (c *Cache) Add(key string, it *Item)
    c.items[key] = it // 'it' escapes: stored in a structure that outlives the call
Here, it (an *Item pointer) escapes because it’s stored in c.items, which is part of the Cache struct, likely a long-lived object. The critical relationship is between the value and its container: a slice created and used entirely within a function might keep its contents on the stack, but the same slice returned or stored in a global variable would cause its contents to escape.
The Traditional Challenge: Manual Escape Analysis with gcflags
Historically, the only authoritative way to ascertain the compiler’s escape analysis decisions has been to use the Go compiler’s debug flags, specifically gcflags with the -m option.
go build -gcflags="-m" ./...This command instructs the compiler to print its optimization decisions, including details about values escaping to the heap. The output typically appears like this:
./user.go:6:2: moved to heap: u
./user.go:7:9: &u escapes to heap
For more verbose reasoning, the -m flag can be repeated (e.g., go build -gcflags="-m -m" ./...). While powerful, this command-line approach presents several significant hurdles for developers:
- Verbosity and Noise: In larger projects, the output can be overwhelming, mixing escape analysis messages with inlining decisions and other diagnostics. Sifting through this volume of text to find relevant information is time-consuming.
- Lack of Context: The output provides file, line, and column numbers, but mapping these back to the source code and understanding the why in context requires constant mental switching between the terminal and the editor.
- Fragmented Workflow: Developers must leave their IDE, run a command, parse the output, and then return to their code to make changes. This context-switching disrupts flow and reduces productivity.
- Steep Learning Curve: The obscure nature of compiler flags and the raw, unformatted output make escape analysis a niche practice, often avoided by even experienced Go developers due to its perceived complexity and inconvenience.
- Difficulty in Comparison: Tracking changes and verifying the impact of optimizations across multiple runs is cumbersome, requiring manual logging or complex scripting.
These pain points have historically relegated escape analysis to a "last resort" diagnostic, despite its profound importance in performance tuning.
GoLand’s Innovation: Bridging the Gap
Recognizing these challenges, the GoLand team at JetBrains developed an integrated solution to democratize escape analysis, making it accessible and actionable directly within the IDE. Introduced in GoLand 2026.2, this feature aims to transform escape analysis from an arcane command-line exercise into a seamless part of the development workflow.
Underneath the hood, GoLand’s tool leverages the same go build command with gcflags, specifically using -gcflags="-m=2 -json=0,<path>" to obtain structured output. However, the crucial innovation lies in the layer GoLand adds on top: parsing this raw data and presenting it intuitively within the editor.
Streamlined Workflow and Intuitive Interface
The process within GoLand is straightforward:
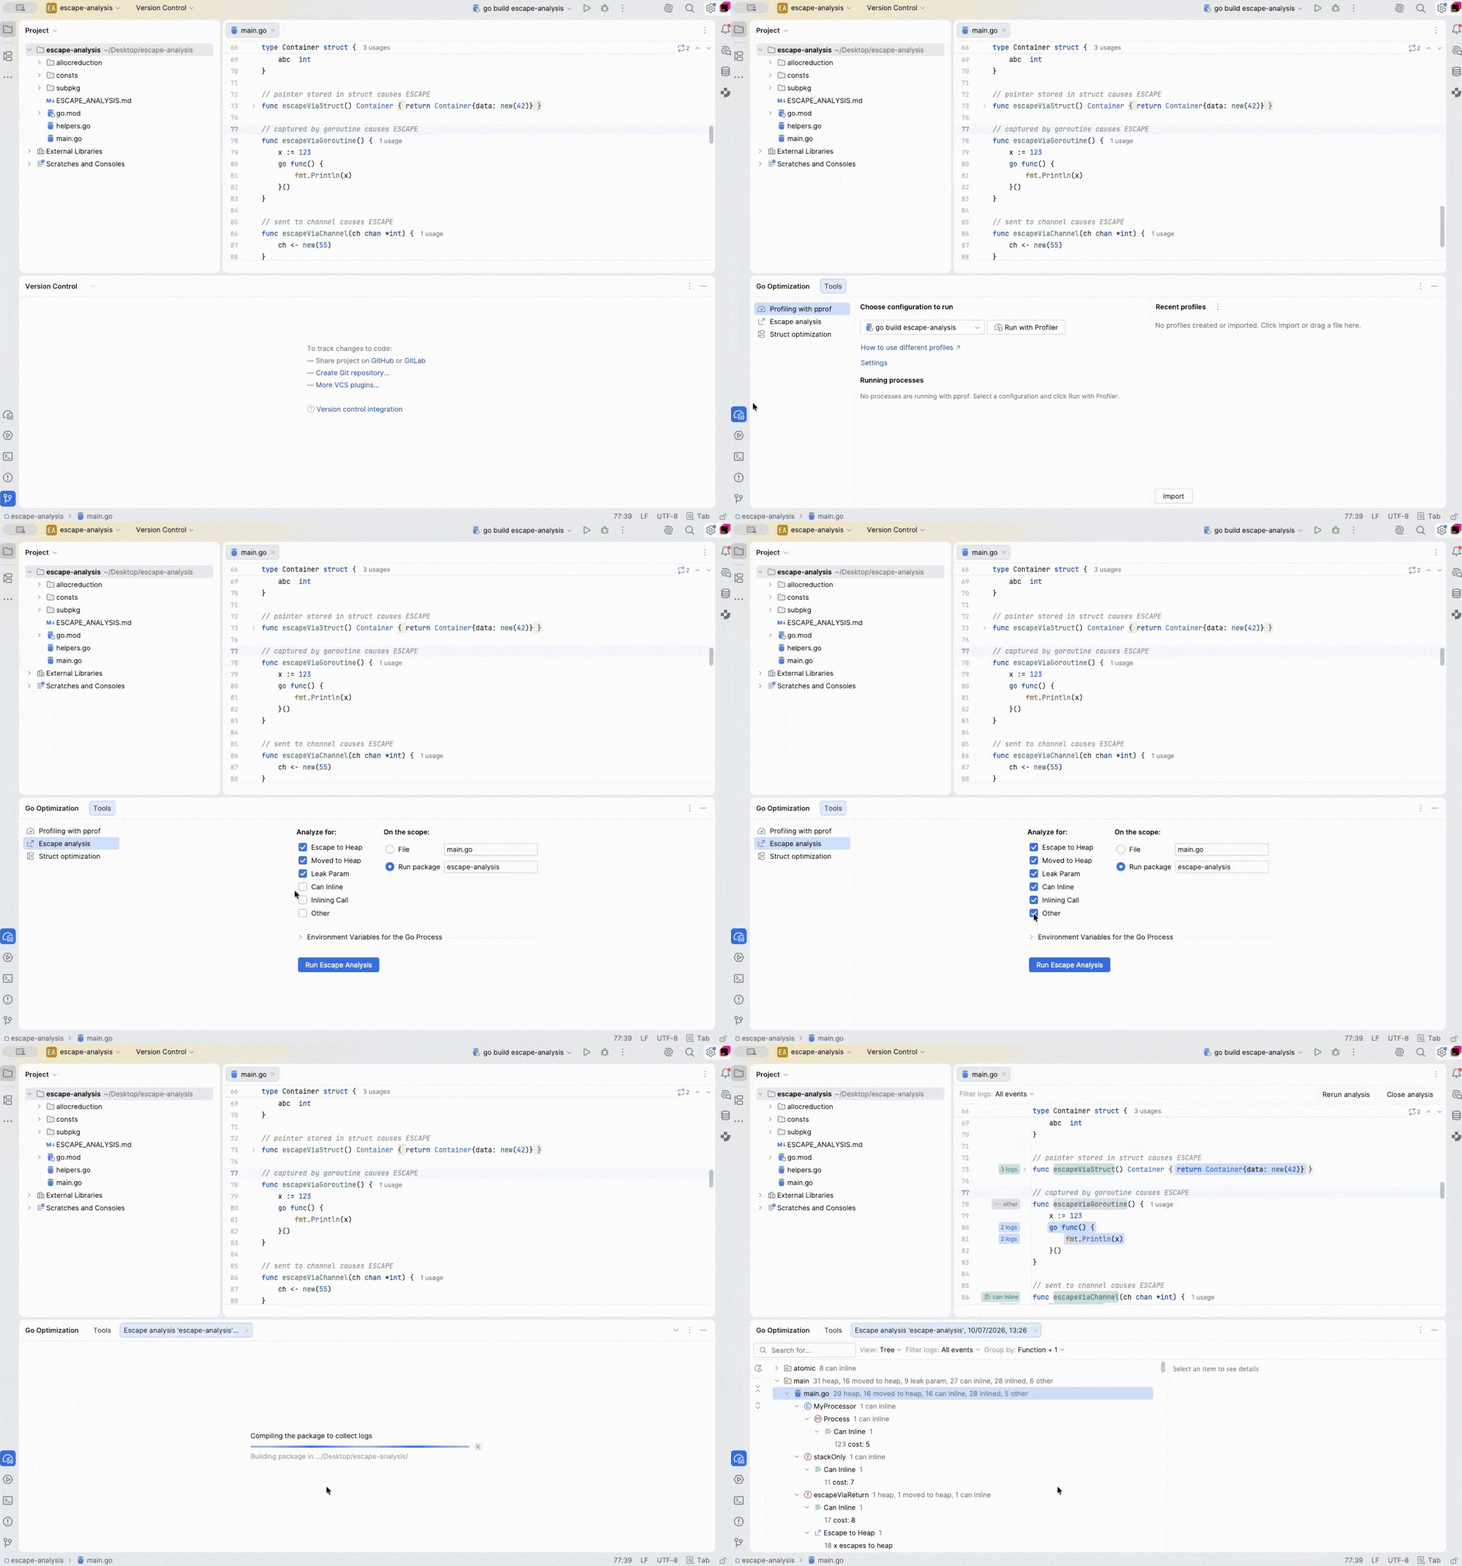
- Access: Open the "Go Optimization" window, select "Escape analysis."
- Scope Selection: Choose to analyze a single file (ideal for focused units like AWS Lambda handlers) or an entire package.
- Customization: Filter message types (e.g.,
Escape to Heap,Moved to Heap,Can Inline) and configure environment variables (likeGOARCH,GOOS, or additionalgoflagssuch as-Nto disable optimizations or-lto disable inlining) to simulate different build environments. - Execution: Run the analysis.
Integrated Output for Enhanced Understanding
Once the analysis completes, GoLand presents the results where they are most valuable:
- In-Editor Annotations: The most impactful feature is the inline display of escape analysis messages directly next to the relevant lines of code in the editor. This immediate visual feedback eliminates context switching, allowing developers to understand the compiler’s decision in situ.
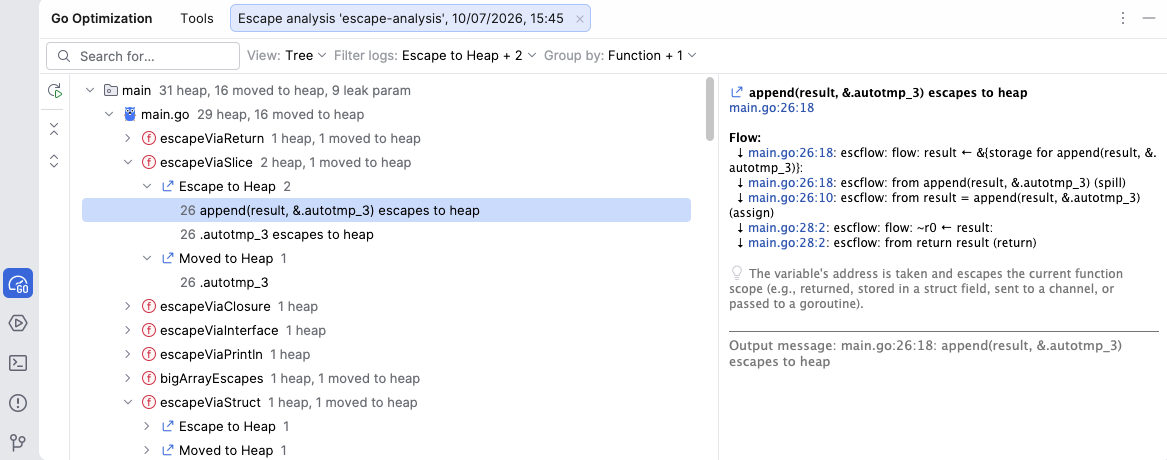
- Dedicated Tool Window: A "Go Optimization" tool window aggregates all messages, allowing for easy navigation, filtering, and sorting. Clicking on a message instantly takes the developer to the corresponding line in the source code.
- Console View: For those who still prefer the raw output or need to see the full compiler diagnostics, a dedicated console tab displays the unparsed
gcflagsoutput.
Iterative Optimization and Comparison
One of GoLand’s most powerful capabilities is enabling iterative performance tuning. Developers can run an analysis, make code changes, rerun the analysis, and then compare the results side-by-side in separate tabs. This visual comparison provides immediate feedback on whether code modifications successfully shifted allocations from the heap to the stack, allowing for data-driven optimization. This complements existing profiling tools, providing a complete picture of performance.
Interpreting Escape Messages
GoLand surfaces several key message types, directly corresponding to compiler reports:
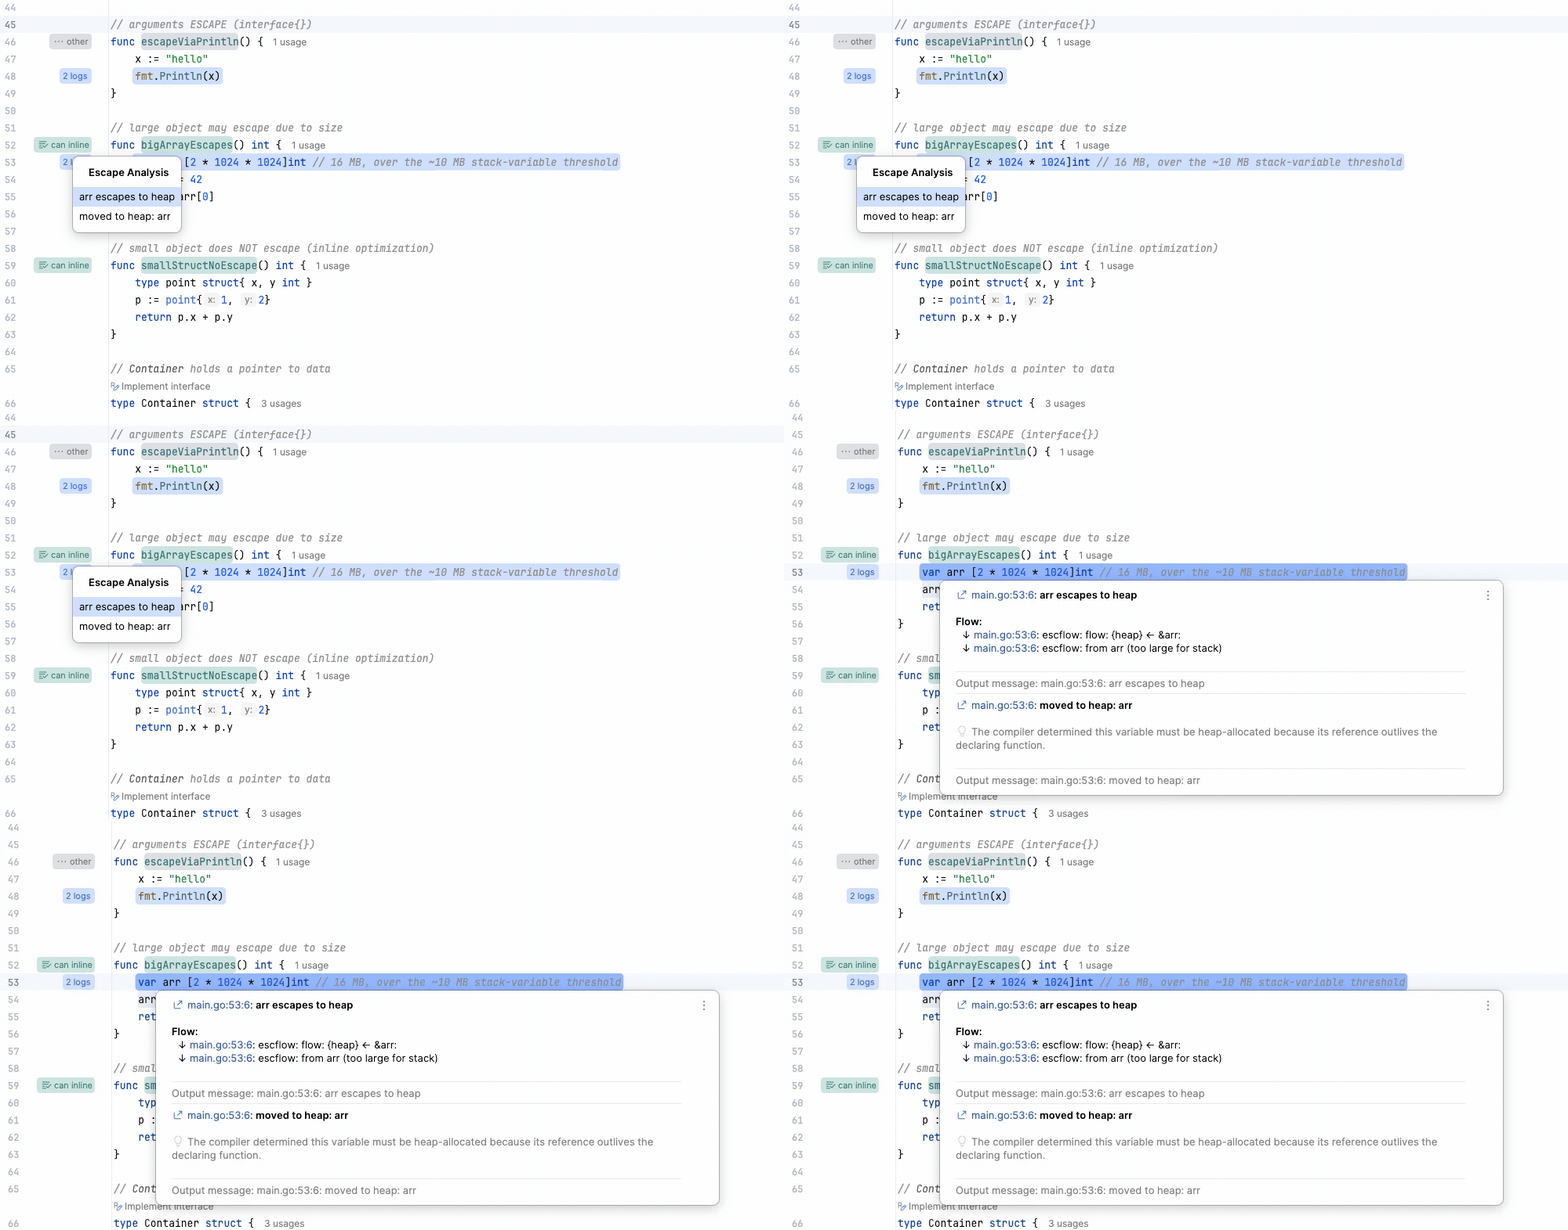
- Escape to Heap: A value must be allocated on the heap because its reference will outlive the creating function.
- Moved to Heap: The compiler could not guarantee the value’s lifetime, so it conservatively allocated it on the heap.
- Leak Param: A function parameter escapes the current function’s scope.
- Can Inline: The compiler identifies a function as a candidate for inlining (replacing the function call with its body).
- Inlining Call: The compiler actually inlined a specific function call.
- Other: Miscellaneous compiler diagnostics related to optimization.
It’s critical to treat these messages as diagnostic signals, not immediate refactoring commands. A "moved to heap" message is simply information; whether it warrants action depends entirely on its measured impact on application performance.
Escape Analysis and Overall Performance Strategy
While GoLand significantly lowers the barrier to entry for escape analysis, it’s crucial to integrate this tool into a broader performance optimization strategy. The old adage about "premature optimization" applies strongly here:
- Measure First: Never optimize without first measuring. Use profiling (CPU, memory, goroutine, blocking) to identify actual bottlenecks. Escape analysis should be deployed after profiling points to allocation pressure as a significant problem.
- Focus on Hot Paths: Concentrate efforts on high-throughput services, tight loops, serialization/deserialization code, and other latency-sensitive workflows. For general-purpose code, an escaping value is usually inconsequential.
- Complementary Tools: Escape analysis is a compile-time snapshot; profiling provides runtime behavior. They are complementary: profiling tells you where to look, and escape analysis helps you understand why allocations are occurring in those hot spots.
- Holistic View: Consider other optimization techniques like efficient data structures, reducing I/O, and optimizing algorithms. Escape analysis is one piece of the performance puzzle.
By strategically using escape analysis, particularly with the aid of integrated tools like GoLand, developers can achieve measurable improvements in application performance, reducing GC pauses, improving throughput, and making their Go applications even more efficient.
Expert Perspectives and Broader Implications
Industry experts consistently highlight the balance Go strikes between developer productivity and runtime performance. The automatic memory management, while simplifying development, has historically presented a black box for performance issues. "Our goal at JetBrains," a spokesperson for the GoLand team could infer, "is to demystify Go’s powerful compiler optimizations and bring them directly into the developer’s workflow. By making escape analysis visually accessible, we empower developers to understand and fine-tune their applications for peak performance without sacrificing productivity."
The broader implication of such tools is a shift in Go development practices. What was once an esoteric skill for a select few performance gurus is becoming more mainstream. This democratization of advanced diagnostics means:
- Improved Code Quality: Developers gain a deeper understanding of memory semantics, leading to more consciously optimized code.
- Enhanced Debugging: Memory-related performance issues become easier to diagnose and fix.
- Faster Iteration: The ability to quickly test and compare optimization attempts accelerates the performance tuning cycle.
- Greater Adoption in Performance-Critical Domains: As Go becomes even more transparent in its performance characteristics, its suitability for highly demanding applications in areas like finance, gaming, and real-time data processing increases.
Best Practices for Effective Escape Analysis
To maximize the benefits of escape analysis in real-world projects, consider the following checklist:
- Profile First: Always begin with CPU and memory profiling to pinpoint actual performance bottlenecks. Do not optimize without data.
- Focus on Hot Paths: Direct your escape analysis efforts toward code segments that profiling identifies as allocation-heavy and critical to performance.
- Understand the "Why": Don’t just identify escapes; comprehend why they are happening. This understanding is key to informed refactoring.
- Iterate and Measure: Make small changes, rerun escape analysis, and then benchmark the code to confirm actual performance improvements.
- Be Pragmatic: Not every heap allocation is a problem. Strive for readability and maintainability, only optimizing when a clear performance benefit is demonstrated.
- Leverage IDE Tools: Utilize integrated solutions like GoLand’s escape analysis feature to streamline the diagnostic process and enhance your workflow.
- Stay Updated: Keep abreast of Go compiler improvements. Newer versions may optimize away escapes that were present in older versions.
- Consult Official Documentation: Refer to Go’s official
Guide to the Go Garbage Collectorfor comprehensive optimization strategies, including those related to escape analysis.
By adopting these practices, Go developers can effectively wield escape analysis as a powerful tool to build more efficient, high-performance applications, further solidifying Go’s position as a robust language for modern software development.
Frequently Asked Questions (FAQ)
Does escape analysis directly improve Go app performance?
Escape analysis, as a part of the Go compiler’s optimization process, inherently contributes to better performance by favoring fast stack allocations and reducing garbage collection overhead. However, as a developer tool, escape analysis is a diagnostic. It doesn’t itself optimize; rather, it provides insights. Performance improvement comes from developers using these insights to identify and eliminate avoidable heap allocations in performance-critical sections of their code. For non-critical code, acting on escape analysis results often yields no measurable change.
Is escape analysis the same as profiling?
No, they are distinct but complementary. Profiling analyzes your program at runtime to identify where it spends its time (CPU) or consumes memory (heap). It tells you what is slow or memory-intensive. Escape analysis is a compile-time process that determines where values are allocated (stack vs. heap) and why. Profiling tells you where to look for performance issues, and escape analysis helps you understand the underlying memory allocation reasons in those specific locations.
Can the results of an escape analysis change between Go versions?
Yes, absolutely. Escape decisions are made by the Go compiler, which is continuously improved by the Go team. New Go versions often include enhanced analysis algorithms and inlining heuristics. This means a value that might escape to the heap in one Go version could potentially remain on the stack in a newer version (e.g., due to improvements in Go 1.25 and 1.26). Always check with the specific Go version you are compiling with.
Should developers avoid pointers to reduce heap allocations?
Not as a blanket rule. While returning or passing pointers can indeed cause values to escape to the heap, pointers are a fundamental and often idiomatic construct in Go. Avoiding them everywhere can harm code readability, make API design more cumbersome, and even hurt performance if it leads to expensive copying of large values. Decisions should be based on API clarity, maintainability, and, most importantly, measured performance impact. Use escape analysis as a tool to check the implications of pointer usage, not to enforce a rigid "no pointers" policy.
Do interfaces always cause values to escape?
No. Passing values through interfaces can contribute to heap allocations in certain scenarios, often related to dynamic dispatch or when the underlying concrete type’s lifetime is uncertain. Common examples include fmt.Println or generic interface parameters. However, the Go compiler is increasingly smart at optimizing interface usage, and many interface calls do not result in heap allocations. Interface boundaries are areas worth observing in the compiler output, but they are not a guaranteed source of escapes.
When should I care about Go escape analysis?
You should primarily care about Go escape analysis when you have a performance-sensitive code path and concrete evidence (from profiling) that memory allocations or garbage collection pressure are contributing to a performance bottleneck. If profiling indicates excessive allocations in a hot loop, a high-throughput service, or critical serialization/deserialization logic, then escape analysis becomes an invaluable diagnostic tool. For everyday code that already meets its performance targets, you can generally trust the compiler to do its job and focus on other development priorities, as Go intended.