Behind the Scenes: How the OpenTelemetry Plugin Maps Your Microservices in Real-Time

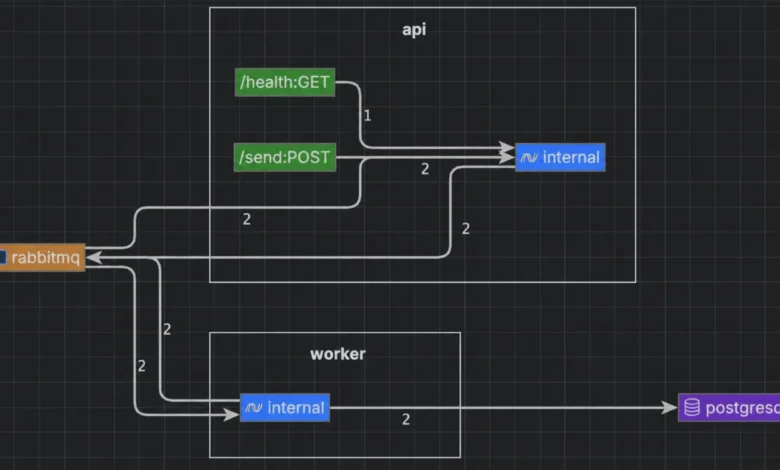
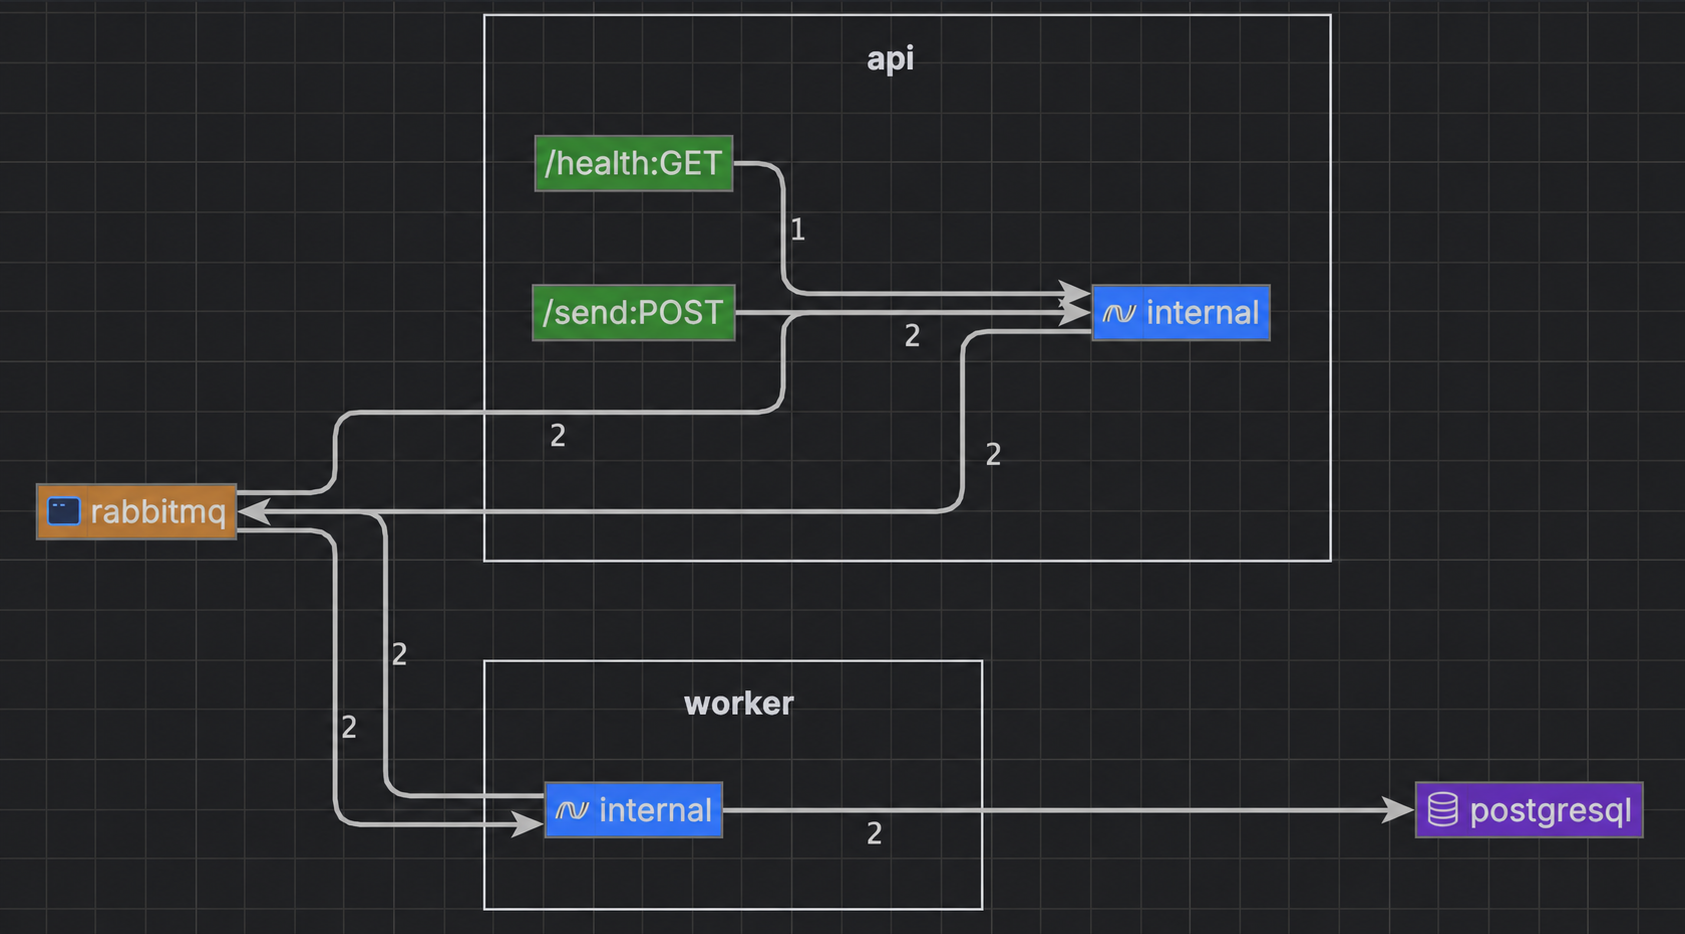
In the contemporary landscape of distributed systems, engineering teams frequently encounter a recurring obstacle: the rapid divergence between documented architecture and the reality of a live production environment. As projects scale, manual diagrams often become obsolete within weeks, failing to capture the nuance of new message queues, deprecated service interactions, or undocumented microservices. To bridge this divide, JetBrains has introduced a sophisticated Service Map feature, developed through a strategic collaboration between the Rider Execution team and the Software Engineering Research division. This tool, integrated directly into the OpenTelemetry plugin, leverages real-time dynamic analysis to visualize system architecture by observing how services interact at runtime.
The fundamental challenge in system observability is that static analysis of source code rarely reflects the complex, asynchronous nature of distributed software. While traditional documentation provides a theoretical framework, it lacks the empirical accuracy required for effective debugging and system maintenance. By utilizing OpenTelemetry—a vendor-agnostic standard for telemetry data—JetBrains has created a solution that is independent of specific technology stacks, supporting languages including Java, .NET, Python, and Go across the entire JetBrains IDE ecosystem, from IntelliJ IDEA and PyCharm to GoLand and WebStorm.
The Mechanism of Dynamic Mapping
The core of the Service Map feature lies in the interpretation of traces. In the paradigm of observability, data is traditionally categorized into the "three pillars": logs, which provide granular details of events; metrics, which offer quantitative performance data; and traces, which map the lifecycle of a request as it traverses various components. Within OpenTelemetry, these traces are composed of "spans"—units of work that represent a specific operation.
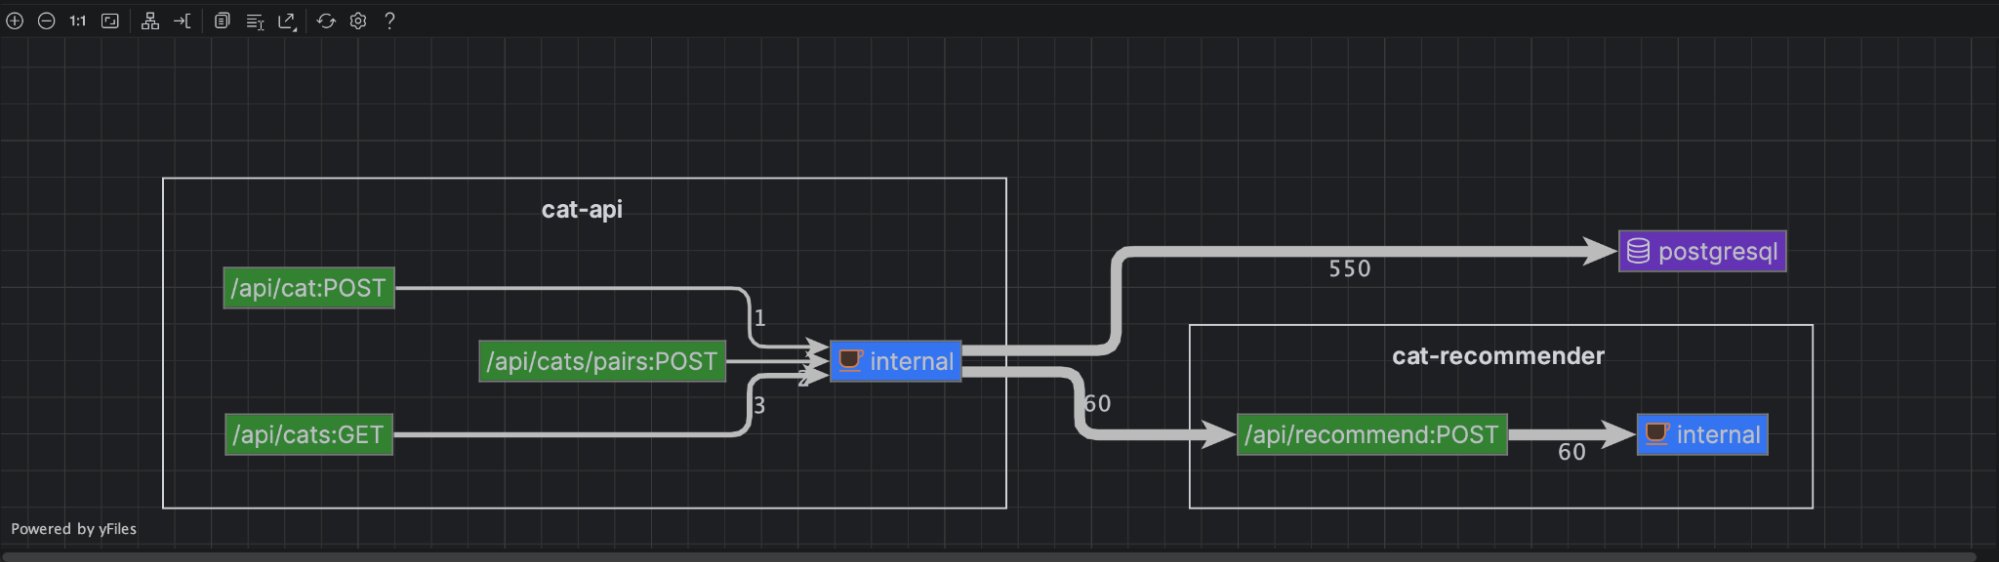
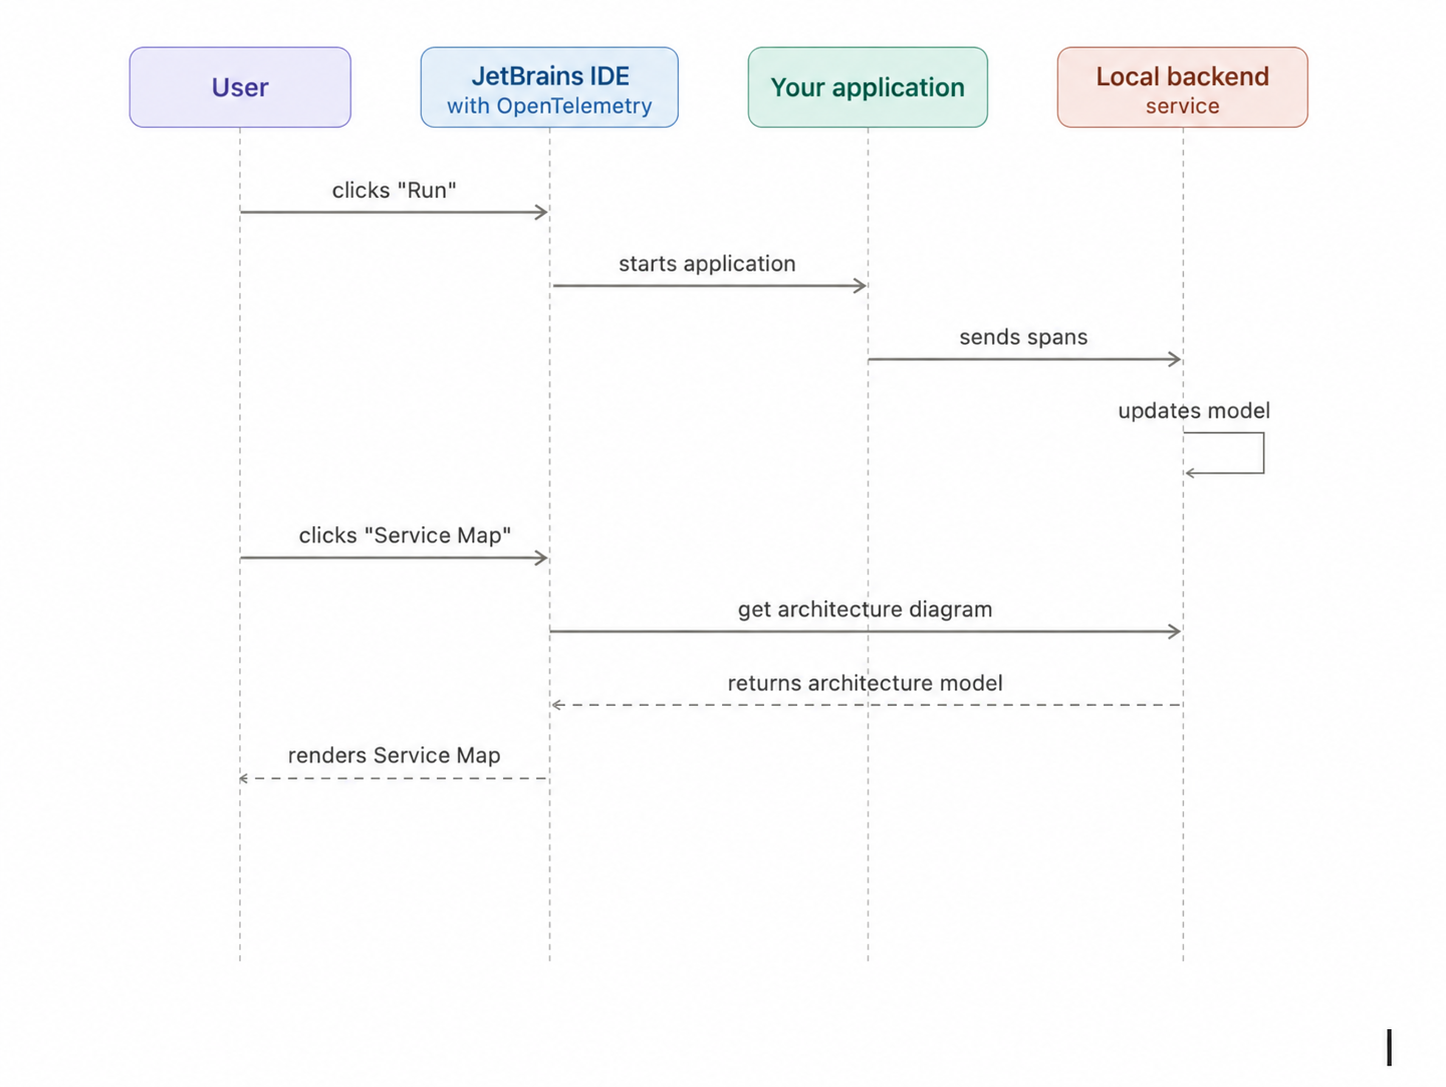
The JetBrains plugin operates by initiating a lightweight local OpenTelemetry backend upon the developer’s IDE startup. When the user executes a project in "Run" mode, the plugin captures the stream of spans generated by the application. This data serves as the "runtime truth," allowing the system to construct an architecture map that is not inferred from static files but generated from the actual traffic flowing through the application.
Overcoming Telemetry Chaos
The implementation of this feature required the engineering team to address several significant technical hurdles inherent to telemetry data. First, the asynchronous nature of distributed systems means that spans often arrive at the collection backend out of order. A parent span might be processed only after its children have already been logged, complicating the reconstruction of the call tree. Second, there is no explicit "end-of-trace" signal, necessitating an algorithm that can handle incomplete or late-arriving data without stalling the visualization. Finally, OpenTelemetry spans do not utilize strictly typed payloads; instead, they rely on key-value attributes. The reconstruction algorithm had to be sophisticated enough to infer the nature of an interaction—whether an HTTP call, a database query, or a message queue operation—solely by analyzing these semantic attributes.
To solve these issues, the team implemented a stream-processing algorithm. This approach allows the plugin to process every span the moment it arrives. By inspecting attributes such as http.request.method and http.response.status_code, the system classifies the operation type. Furthermore, the algorithm manages service boundaries by correlating client-side spans with corresponding server-side spans. If a partner span is missing, the system buffers the information, incrementally updating the map as the missing pieces arrive, ensuring that the visual representation remains accurate even amidst network latency or data fragmentation.
Broader Implications for Engineering Workflow
The introduction of real-time service mapping represents a significant shift in how developers interact with complex microservice architectures. Traditionally, onboarding a new engineer involved a tedious process of reviewing outdated documentation and performing "tribal knowledge" transfers. With the Service Map, the architecture is visualized automatically, allowing engineers to verify their mental models against the live system immediately.

This capability is particularly vital for debugging. Discrepancies between expected and observed system behavior often reveal architectural "drift," where the actual production flow deviates from the intended design. By identifying these deviations during the development phase, teams can mitigate technical debt before it reaches production environments. Moreover, because the tool is language-agnostic, it provides a unified visibility layer for organizations that employ polyglot microservice architectures.
Supporting Ecosystem Advancements: Performance and Community
The broader landscape of Python and software engineering in mid-2026 suggests a growing emphasis on performance and infrastructure efficiency. Concurrent with the release of JetBrains’ Service Map, the open-source community has seen significant advancements in performance-oriented tooling. For instance, the emergence of fastlogging-rs, a Rust-powered logging framework, highlights the industry’s shift toward offloading resource-intensive tasks to systems-level languages to alleviate bottlenecks in I/O-bound applications. With performance gains that can reduce logging overhead from minutes to seconds, such tools complement the observability efforts of plugins like JetBrains’ OpenTelemetry integration.
Furthermore, the Python Software Foundation (PSF) recently formalized its Strategic Plan for 2026–2031, which places a renewed focus on security baselines and vulnerability management. This alignment with industry standards—such as OpenTelemetry—is part of a broader trend toward professionalizing the software development lifecycle. As organizations like the Django Software Foundation continue to search for executive leadership to steward their long-term growth, the focus remains on building sustainable, secure, and observable infrastructure.
The Role of Human Oversight in the AI Era
While automated tools like the Service Map and AI-driven coding agents are revolutionizing development, industry experts remain cautious regarding the role of human judgment. As discussed in recent technical discourse, such as the debate regarding the necessity of coding skills in an AI-dominated world, the ability to decompose problems and understand architectural foundations remains a "durable" skill. Tools like JetBrains’ new plugin are designed to augment, not replace, the developer’s capacity for architectural reasoning. By automating the visual representation of the system, the tool frees the engineer to focus on the higher-order task of system design and problem resolution.

The integration of AI-coding agents—such as the Claude Code agent recently integrated into the Wing Python IDE—further highlights this trend. While these agents can handle the implementation of unit tests or the resolution of code warnings, the underlying architectural integrity is still managed by the developer. The Service Map acts as a diagnostic lens, providing the "compass" that prevents AI from making poor structural decisions.
Conclusion
The release of the Service Map feature within the JetBrains OpenTelemetry plugin serves as a milestone in the evolution of developer tooling. By transforming raw, asynchronous telemetry data into a coherent, real-time map of microservice dependencies, it addresses one of the most persistent frustrations in modern software engineering: the lack of clarity regarding how a system actually functions.
As microservice architectures continue to grow in complexity, the ability to visualize and verify system interactions will become an essential component of the engineering toolkit. Whether by identifying unexpected database queries or monitoring message queue interactions, this dynamic analysis approach provides developers with the objective data needed to make informed decisions. Combined with advancements in performance logging and a commitment to robust software foundations, these tools represent a proactive effort to tame the inherent chaos of distributed systems, ultimately leading to more resilient, observable, and maintainable software. As the industry moves toward 2027 and beyond, the synergy between observability, performance optimization, and human architectural judgment will define the next generation of enterprise software development.